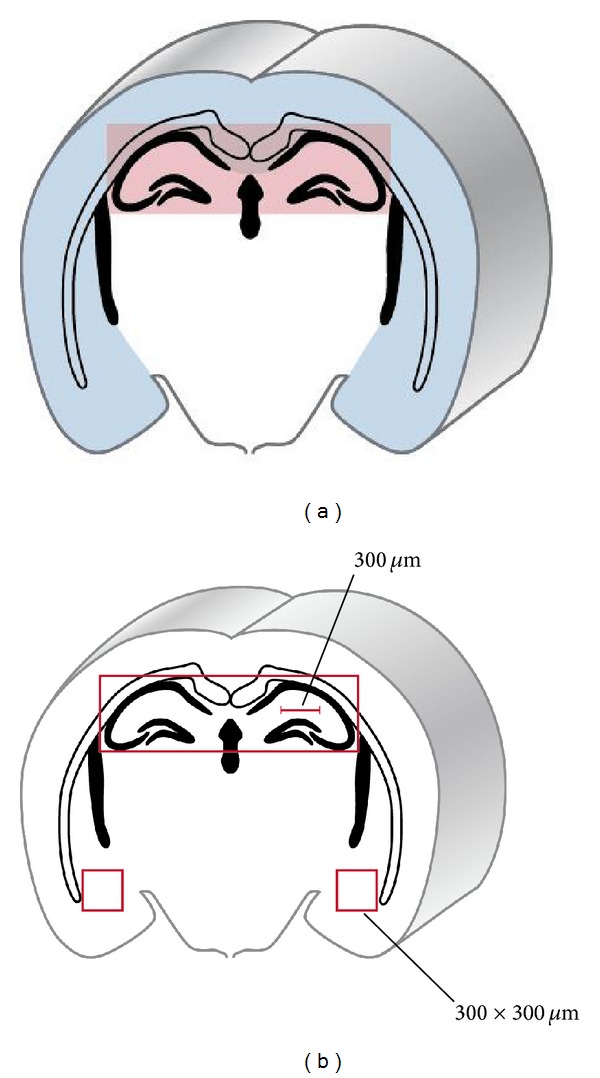
Figure 1.

Microclot formation analyzed in the hippocampus and cortex. (a) Schematic drawing of regions used for analysis of fibrinogen immunostained microclots in the hippocampus (red bar) and the cortex (blue bar). (b) Specific regions of interest (ROI) from the hippocampus and cortex used for dimensional analysis.
