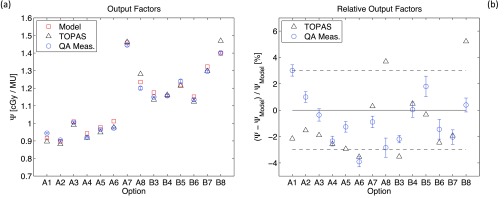
FIG. 3.

(a) Absolute output factors expressed in cGy/MU for all the options analyzed during QA and listed in Table I. Data are reported for theoretical model calculations, TOPAS simulations and QA measurements. (b) Relative variation from the predictive theoretical model of output factors simulated with TOPAS and measured during QA. The horizontal dashed lines represent the acceptable clinical tolerances for QA measurements.
