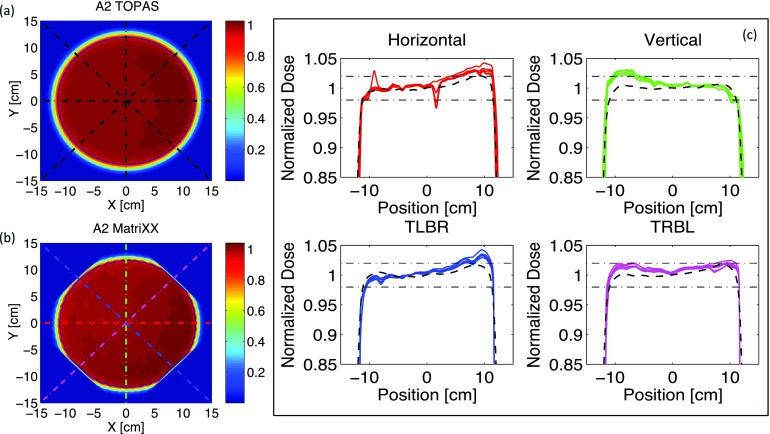
FIG. 4.
(a) and (b) Simulated and measured 2D dose distributions of the SOBP used for option A2 (see Table I). Profiles are measured and simulated at the isocenter and normalized to their mean central dose. The round contours denote the 90% isodose lines. (c) Dose profiles along the dashed lines shown in Figs. 4(a) and 4(b). Full lines refer to five series of measured data. Dashed lines are TOPAS simulations. Horizontal dashed-dotted lines represents the acceptable clinical tolerances for field flatness. In the plot titles, TLBR stands for top-left-bottom-right and TRBL for top-right-bottom-left. The dip at ~1 cm in the measured horizontal profiles is due to few damaged ion chambers in the MatriXX detector.

