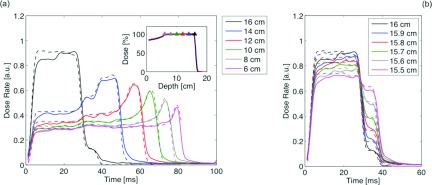
FIG. 8.

(a) and (b) DRFs at different locations inside the SOBP (range: 16 cm, modulation width: 10 cm). Full lines refer to ion chamber measurements; dashed lines are TOPAS simulations. Inset of Fig. 8(a): measured and simulated SOBP; triangles indicate the positions where DRFs were measured and simulated.
