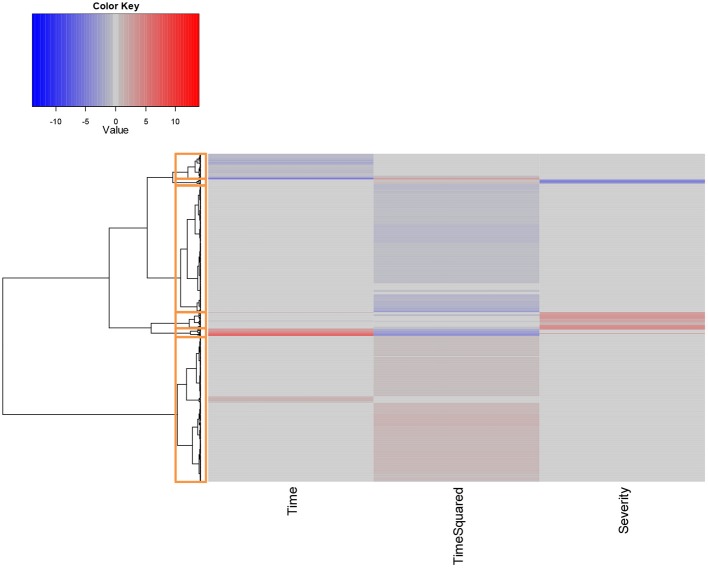
Figure 4.
Hierarchical clustering of unique probe IDs based on fitted model coefficients. All coefficients were scaled prior to analysis to assign equal weight to each covariate. Red values denote coefficients that are positively associated with increases in the given covariates at the α = 0.05 significance level, while values in blue denote significant negatively associated coefficients.

