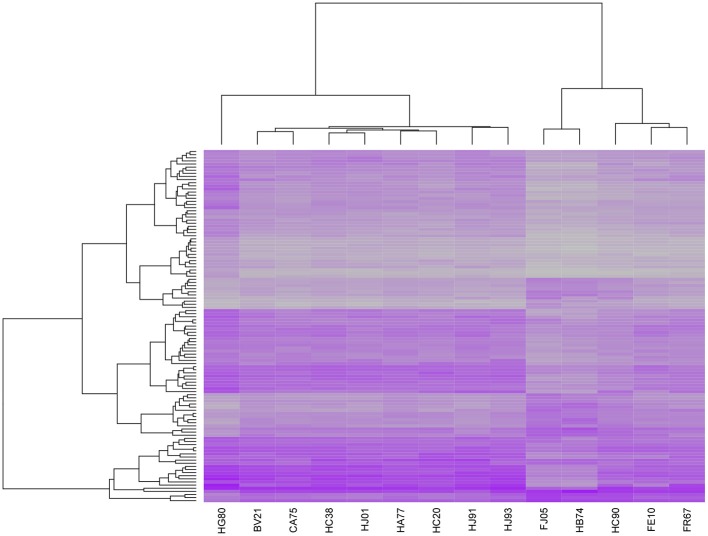
Figure 6.
Heatmap of expression profiles for 106 genes significantly associated with post-exposure time T and/or final severity score S and included in a set of 393 transcripts that were previously reported to effectively discriminate between cases of active and latent TB in blood samples (Berry et al., 2010). Hierarchical clustering of the samples on the basis of this subset separates 5 of the 6 least severe cases in our sample from the remaining 9 cases.

