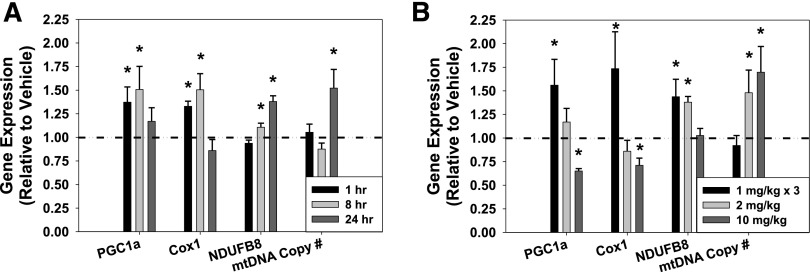
Fig. 4.
Gene expression of PGC1α, Cox1, NDUFB8, and mitochondrial copy number after selective 5-HT1F receptor agonist LY344864 (2 mg/kg) in the kidney cortex at 1, 8, and 24 hours (A) and after selective 5-HT1F receptor agonist LY344864 at 1 mg/kg every 8 hours (1 mg/kg × 3), 2 mg/kg, and 10 mg/kg in the kidney cortex at 24 hours (B). Data are X + S.E.M., n ≥ 3. *Significantly different from vehicle (P < 0.05).

