Fig. 3.
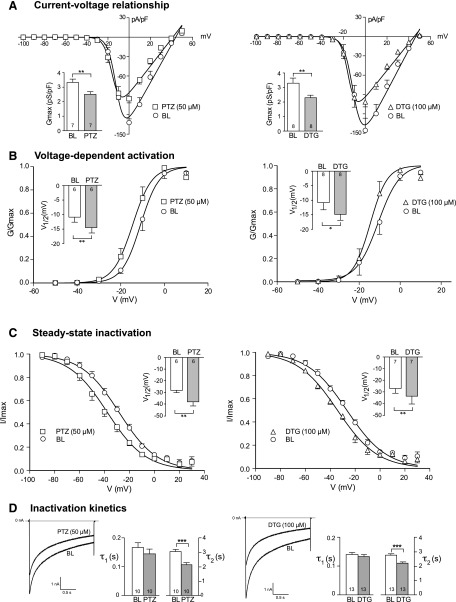
σ1R modulates kinetic properties of VGCC in control animals. (A) ICa was measured with a square wave voltage command (200 milliseconds; 10 mV increment from −100 to 50 mV; holding potential at −65 mV). Average inward current density (pA/pF) against current-voltage relationship (I-V) elicited by PTZ (50 μM) and DTG (100 μM) was fit to a single Boltzmann function (see Materials and Methods). (B) Voltage-dependent activation of VGCC was derived from the I-V curve by Boltzmann analysis. (C) The steady-state inactivation of ICa was measured during a 4-second square wave depolarization (−100 to 30 mV in 10-mV increments) with ICa determined by a subsequent test pulse (20 milliseconds to 0 mV). Results are normalized to maximal peak current (I/Imax). (D) A simple step protocol (−100 to 0 mV for 2 seconds) was applied to measure the inactivation kinetics by a two-exponential function (τ1 and τ2). Inset figures revealed summary data of maximal conductance (Gmax; A), voltage at which current is half-maximal (V1/2; B and C), and inactivation constant (τ; D). Mean ± S.E.M.; number in bars represents the sample size; *P < 0.05; **P < 0.01; ***P < 0.001. BL, baseline.

