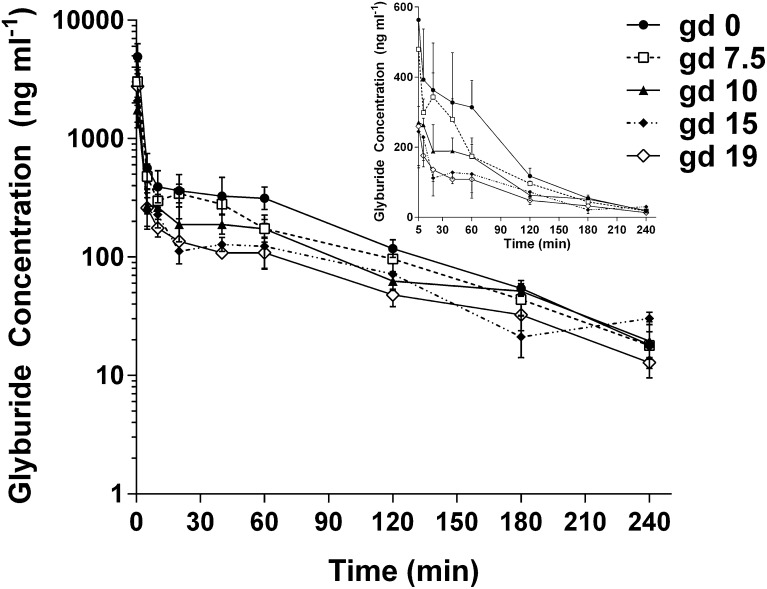
Fig. 1.
Maternal plasma concentration time profiles of glyburide in wild-type FVB pregnant mice throughout gestation. Mice were administered 20 µg glyburide per mouse by retro-orbital injection. Data from gd 0 (●), gd 7.5 (□), gd 10 (▴), gd 15 (♦), and gd 19 (⋄) are shown as the mean ± S.D. (n = 3–5 mice per time point). The main figure shows a semilogarithmic plot and the insert in the upper right corner shows a rectilinear plot (including data from 5 to 240 minutes). Nonpregnant mice are referred to as gd 0.

