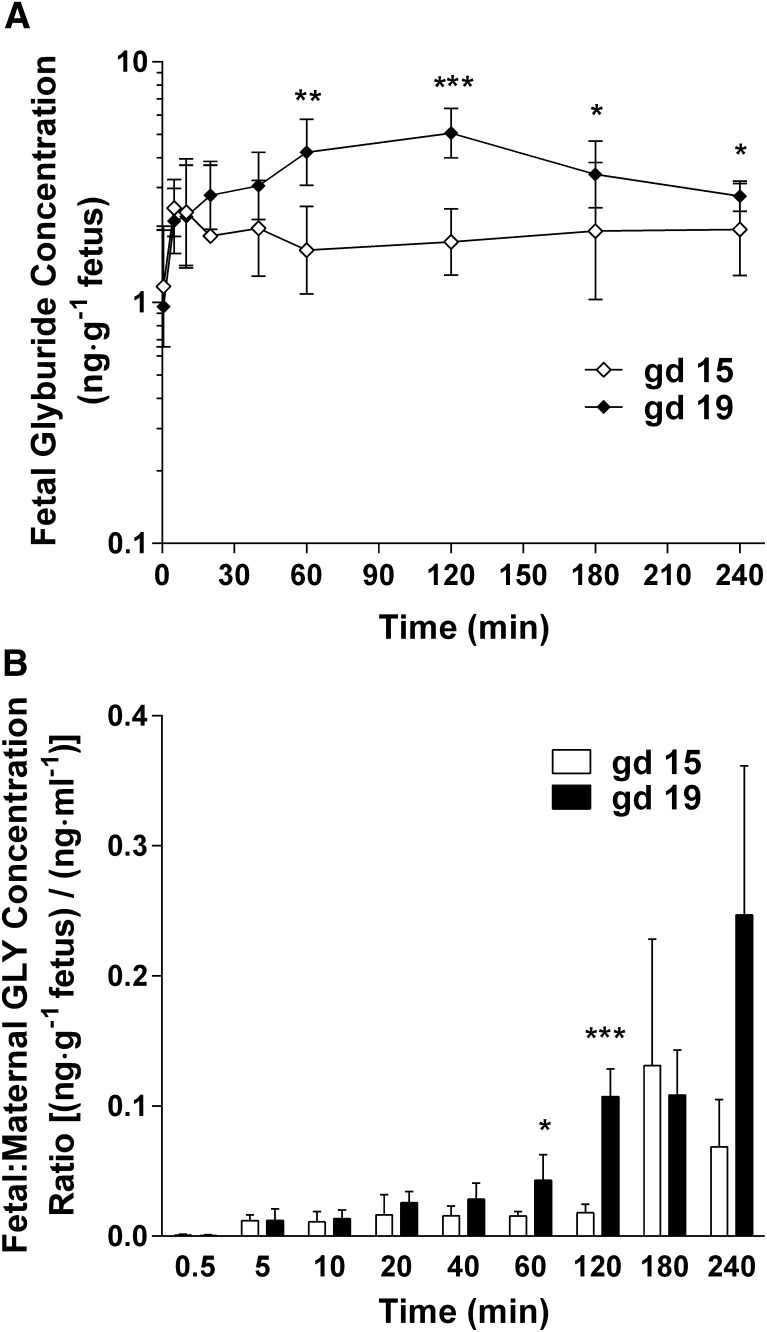
Fig. 3.
Fetal glyburide concentration time profiles and fetal/maternal plasma concentration ratios in mid-late gestation. Data from gd 15 (⋄) and gd 19 (♦) are shown as the mean ± S.D. (n = 20–40 fetuses per time point). (A) Semilogarithmic plot of fetal glyburide concentration over time. (B) Fetal/maternal plasma glyburide concentration ratios. Statistically significant differences in fetal concentrations and fetal/maternal plasma concentration ratios between gd 15 and 19 were determined using a generalized estimating equation approach with an independent correlation structure. P values were adjusted for multiple testing using a Bonferroni correction assuming a significance level of 0.05. *P < 0.05; **P < 0.01; ***P < 0.001. GLY, glyburide.

