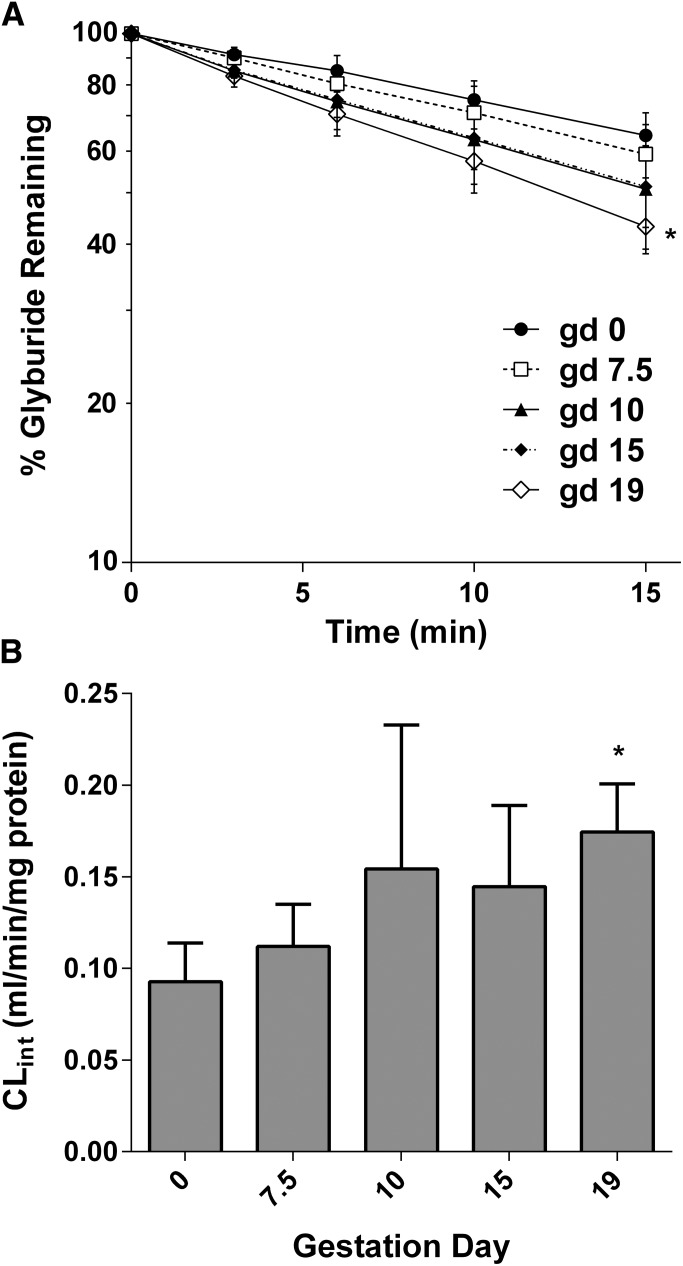
Fig. 4.
Gestational age–dependent depletion kinetics of glyburide in mouse liver microsomes. (A) Semilogarithmic plot of glyburide depletion over time in mouse liver microsomes. Data from gd 0 (●), gd 7.5 (□), gd 10 (▴), gd 15 (♦), and gd 19 (⋄) are shown as the mean ± S.D. (n = 4–6 livers per gestation day). (B) Gestational age–dependent changes in glyburide CLint. Data are the mean ± S.D. (n = 4–6 livers per gestation day). Statistically significant differences between gd 0 and gd 7.5, 10, 15 or 19, as indicated by an asterisk, were determined by the Kruskal–Wallis test followed by the Dunn’s multiple comparison test assuming a significance level of 0.05. Nonpregnant mice are referred to as gd 0.

