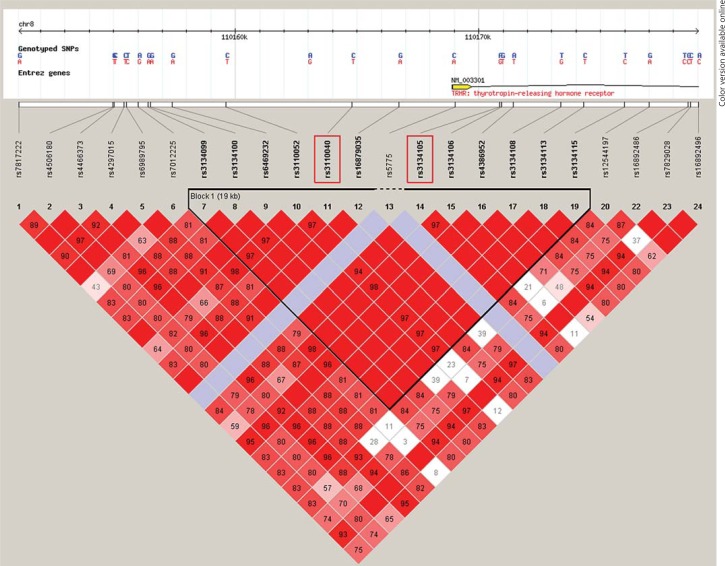
Fig. 2.
The chosen LD block in the genomic region encompassing a TRHR-relevant portion. This figure shows rs3134105 and rs3110040 (red-rimmed) and their location. The framed triangle defines the LD block identified by Haploview. Red squares represent strong LD (100%). Red tone and LD percentage (numbers in the squares) decrease with reduction in LD strength.

