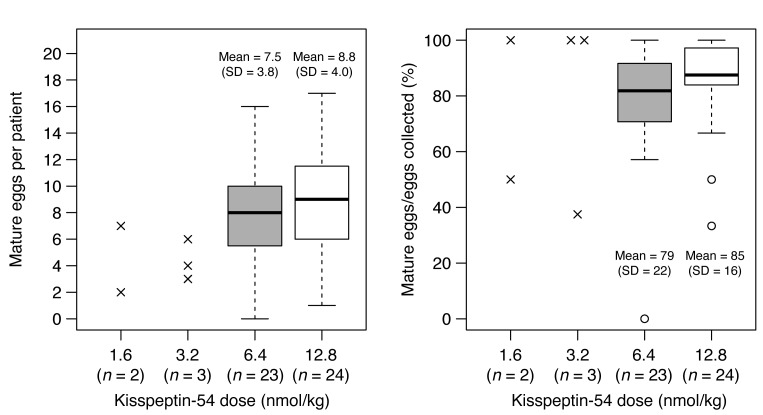
Figure 3. Egg maturation in patients following administration of kisspeptin-54.
Individual data are shown by x’s for the 1.6 and 3.2 nmol/kg doses. Box plots are shown for the 6.4 and 12.8 nmol/kg doses: line, median; box, interquartile range; whiskers extend to the extremes of the data (1.5× the interquartile range); open circles, very extreme outliers. The difference in absolute number of mature eggs between the 12.8 and 6.4 nmol/kg doses was 1.2 (95% CI, –1.0 to 3.5). For the percentage of eggs collected that were mature, this difference was 6% (95% CI, –5% to 17%).

