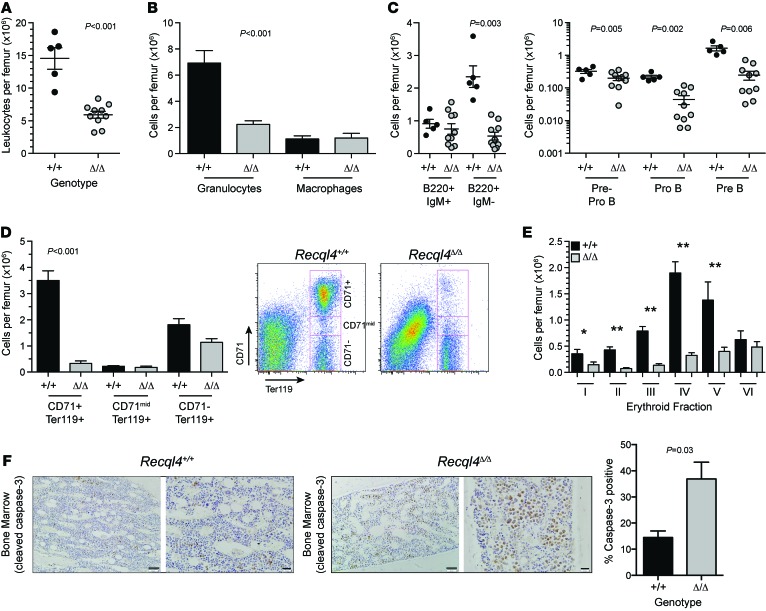
Figure 2. BM failure following deletion of Recql4.
(A) BM cellularity per femur.(B) Numbers of granulocytes and macrophages per femur. (C) B lymphocyte number per femur and the indicated B cell subset. (D) Erythroid fractions based on CD71/Ter119 staining and representative FACS plots. (E) Erythroid fractions based on Ter119/CD44/FSC phenotype. (F) Analysis of cleaved caspase-3 staining in the BM. Scale bars: 100 μm (low power image); 50 μm (higher power image). Quantitation of percentage cleaved caspase-3 positive cells in each genotype from 3 hpf per sample, n = 3 per genotype. Data expressed as mean ± SEM, Student’s t test. *P < 0.05; **P < 0.001. n > 5 per genotype (A–E). Experiments were independently performed on at least 3 separate cohorts, with results pooled for presentation.

