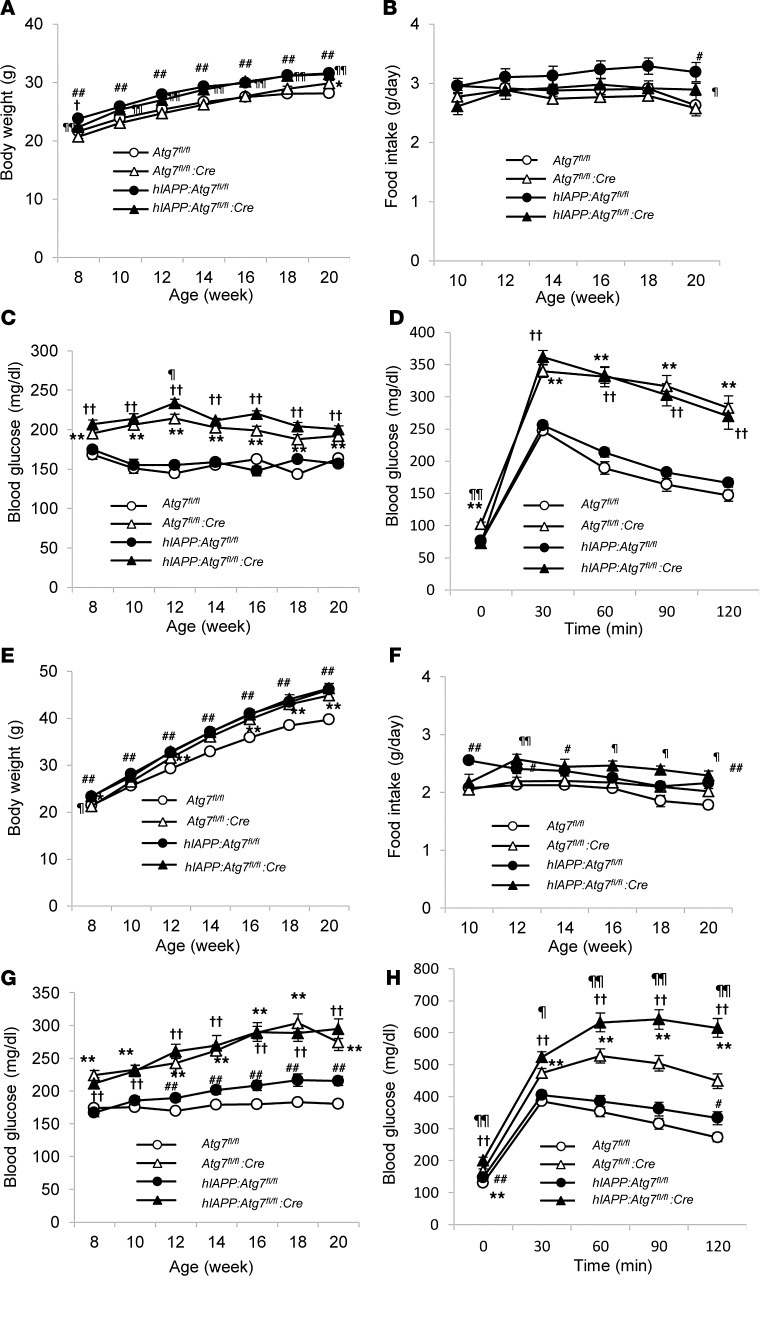
Figure 3. Physiological parameters.
Mice were fed standard diet (A–D) or high-fat diet (E–H) from 8 to 20 weeks of age. Shown are body weight (A and E), food intake (B and F), nonfasting blood glucose levels (C and G), and glucose tolerance (D and H) of Atg7fl/fl (n = 31 [standard], 49 [high-fat]), Atg7fl/fl:Cre (n = 38 [standard], 39 [high-fat]), hIAPP:Atg7fl/fl (n = 31 [standard], 32 [high-fat]), and hIAPP:Atg7fl/fl:Cre (n = 19 [standard], 27 [high-fat]) mice. Data are mean ± SEM. *P < 0.05, **P < 0.01, Atg7fl/fl vs. Atg7fl/fl:Cre; †P < 0.05, ††P < 0.01, hIAPP:Atg7fl/fl vs. hIAPP:Atg7fl/fl:Cre; #P < 0.05, ##P < 0.01, Atg7fl/fl vs. hIAPP:Atg7fl/fl; ¶P < 0.05, ¶¶P < 0.01, Atg7fl/fl:Cre vs. hIAPP:Atg7fl/fl:Cre.

