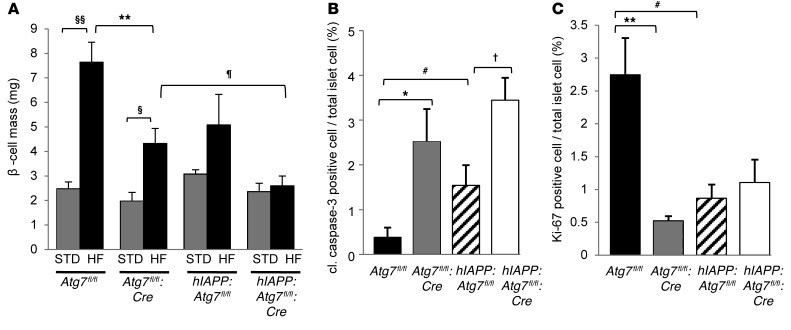
Figure 5. Effect of hIAPP knockin and autophagy deficiency on β cell mass.
(A) β cell mass of Atg7fl/fl, Atg7fl/fl:Cre, hIAPP:Atg7fl/fl, and hIAPP:Atg7fl/fl:Cre mice fed standard (STD) or high-fat (HF) diet. (B and C) Number of cleaved caspase-3–positive (B) and Ki-67–positive (C) intraislet cells in high-fat diet–fed mice of each genotype. In A–C, 5 mice per genotype were prepared for morphometric analysis. Data are mean ± SEM. §P < 0.05, §§P < 0.01, standard vs. high-fat; *P < 0.05, **P < 0.01, Atg7fl/fl vs. Atg7fl/fl:Cre; †P < 0.05, hIAPP:Atg7fl/fl vs. hIAPP:Atg7fl/fl:Cre; #P < 0.05, Atg7fl/fl vs. hIAPP:Atg7fl/fl; ¶P < 0.05, Atg7fl/fl:Cre vs. hIAPP:Atg7fl/fl:Cre.

