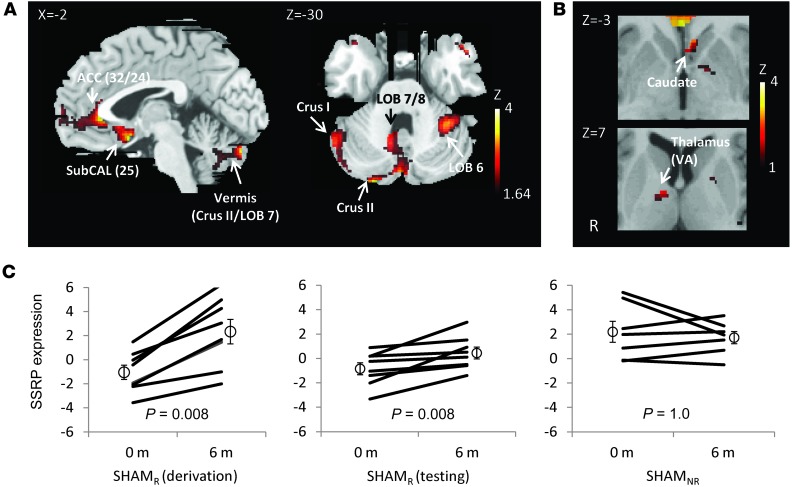
Figure 1. SSRP.
Network analysis of metabolic images obtained for 8 PD patients scanned at baseline and again, under the blind, 6 months after SHAM (see text). (A) The resulting SSRP was characterized by increased metabolic activity in the anterior cingulate cortex (BA 32/24), subgenual cingulate gyrus (BA 25), inferior temporal cortex, hippocampus, amygdala, and posterior cerebellar vermis. ACC, anterior cingulate cortex; LOB, lobule; SubCAL, subcallosal gyrus. Pattern is displayed as a bootstrap reliability map thresholded at z =|1.64|, 1-tailed P < 0.05; 1,000 iterations. (B) SSRP also included contributions from the head of the caudate and anterior putamen (top) and from the VA thalamic nucleus. While voxel weights for these clusters significantly contributed to this network (Table 1), these loadings did not meet the prespecified bootstrap reliability criteria (z = 1.575, 1.472, and 1.348 for the 3 regions, respectively; 1,000 iterations). (C) A significant ordinal trend in SSRP expression (left) was seen in the 8 responders to SHAM who were used to identify the pattern. Each subject exhibited an increase in network expression under the blind at 6 months (P < 0.01, binomial test). A similar ordinal trend in SSRP expression under the blind (P < 0.01, binomial test) was evident in the 8 remaining sham responders (middle) who were not used for pattern identification. An ordinal trend was not observed under the blind (P = 1.0) for the 7 sham nonresponders (right). Three violations were evident in this group, whereas no violations were present in either SHAMR group.

