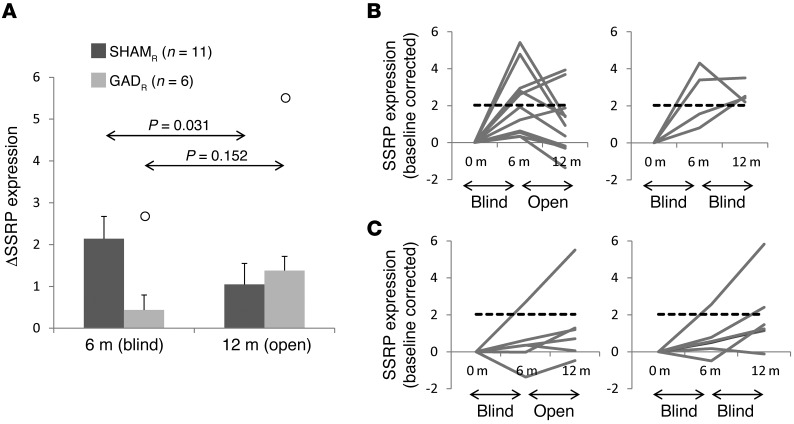
Figure 5. Effects of unblinding on network expression.
(A) Eleven sham (SHAMR) and 6 gene therapy (GADR) responders were rescanned at 12 months after unblinding (see text). The time course of SSRP expression differed for the 2 groups [F(1,15) = 6.900, P = 0.019, group × time interaction, RMANOVA]. Unblinding was associated with a significant decline in network expression in the sham-operated subjects (P = 0.031, LSD test) but not in their gene therapy counterparts (P = 0.152). Outliers (greater than the mean +1.5 × SD) are shown by white circles. (B) After unblinding, the majority of SHAMR subjects (8 of 11 = 72.7%) exhibited a decline in network expression (left), with values falling in the range (dashed line) seen over a comparable time interval in an unblinded disease progression cohort (see text). By contrast, SSRP expression remained above this level (right) in the 4 SHAMR subjects who were still under the blind at 12 months. Dashed line represents 1.5 SD above the mean change in SSRP expression observed in an independent cohort composed of 15 PD subjects scanned twice over a 2-year period (see Supplemental Figure 2B). (C) Six of the 13 gene therapy responders (GADR) who underwent repeat metabolic imaging at 12 months were unblinded prior to the final imaging session. Unblinding had no significant effect on SSRP expression in these subjects. Indeed, in 5 of the unblinded GADR subjects (left), network activity at 12 months was in the open-label progression range (dashed line). Similar network values were observed (right) for the GADR subjects who remained under the blind at the final imaging time point.

