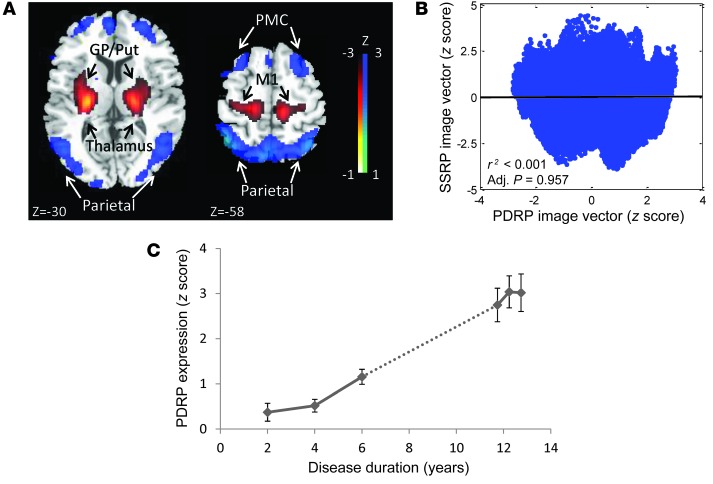
Figure 6. PDRP expression and natural history.
(A) The previously characterized PDRP (11, 13, 49). This network is associated with increased (red) pallidal, thalamic, cerebellar, and motor cortical metabolic activity, with relative reductions (blue) in the lateral premotor and parieto-occipital regions. The displayed voxel loadings on the pattern were shown to be reliable (P < 0.001) by bootstrap estimation. (B) Voxel-wise correlation of standardized regional loadings on the SSRP and PDRP topographies exhibited no spatial correspondence between the 2 networks. Less than 0.0001% of the total voxel weight variation was shared by these patterns (P = 0.957, adjusted for autocorrelation; ref. 42). (C) PDRP expression values computed in the 23 SHAM subjects (right) increased significantly over time (r2 = 0.223, P < 0.001, Bland-Altman correlation). The network progression in this group was continuous (dotted line) with the progression line (r2 = 0.540, P < 0.001) that was determined independently in 15 subjects (left) with early-stage PD (13). The slope of PDRP progression did not significantly differ between the early-stage PD subjects (left, b = 0.141; 95% CI: 0.087–0.194) and those who underwent SHAM (right, b = 0.406; 95% CI: 0.175–0.636).

