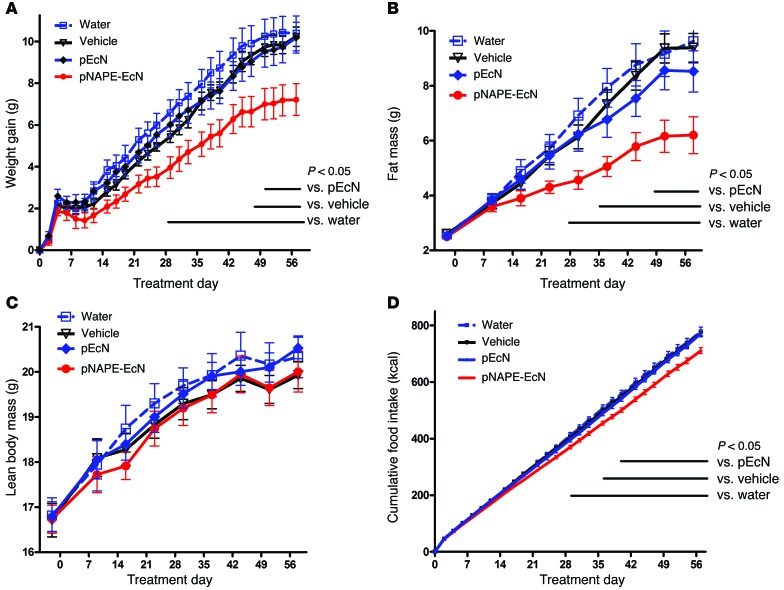
Figure 1. Treatment with pNAPE-EcN, but not pEcN, inhibits gain in body weight and adiposity.
All values are the mean ± SEM (n = 10 mice per group). Solid bars indicate time points with significant differences between pNAPE-EcN and other groups (P < 0.05 by Bonferroni’s multiple comparison test). (A) Effect of treatments on gain in body weight from start of treatment (2-way RM ANOVA, for treatment P = 0.0073, for time P < 0.0001). (B) Effect of treatments on fat mass (2-way RM ANOVA, for treatment P = 0.0127, for time P < 0.0001). (C) Effect of treatments on lean body mass (2-way RM ANOVA, for treatment P = 0.8113, for time P < 0.001). (D) Effect of treatments on cumulative food intake from start of treatment (2-way RM ANOVA, for treatment P = 0.0035, for time P < 0.0001).

