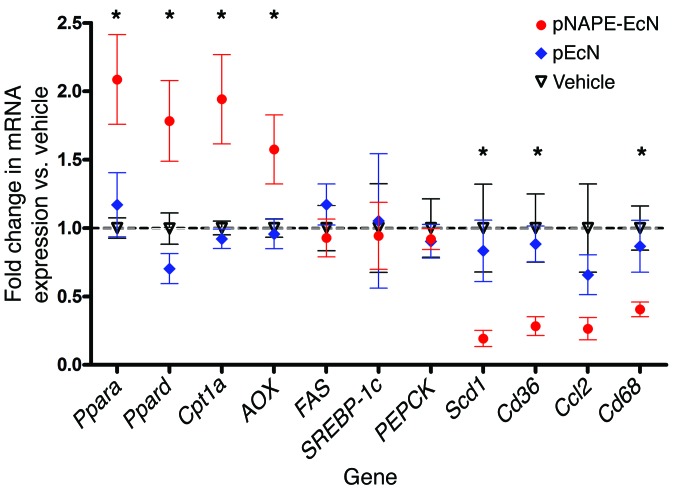
Figure 4. Treatment with pNAPE-EcN induces expression of genes encoding for fatty acid oxidation, but not fatty acid synthesis, and reduces expression of inflammatory genes in the liver.
Liver mRNA was measured by qRT-PCR using primers specific for each gene. β-actin (Actb) was used as a control, and all values were normalized to the vehicle group (mean ± SEM, n = 10 mice per group). *P < 0.05 by 1-way ANOVA for individual gene expression and by Dunnett’s multiple comparison test versus vehicle for pNAPE-EcN, but not for pEcN.

