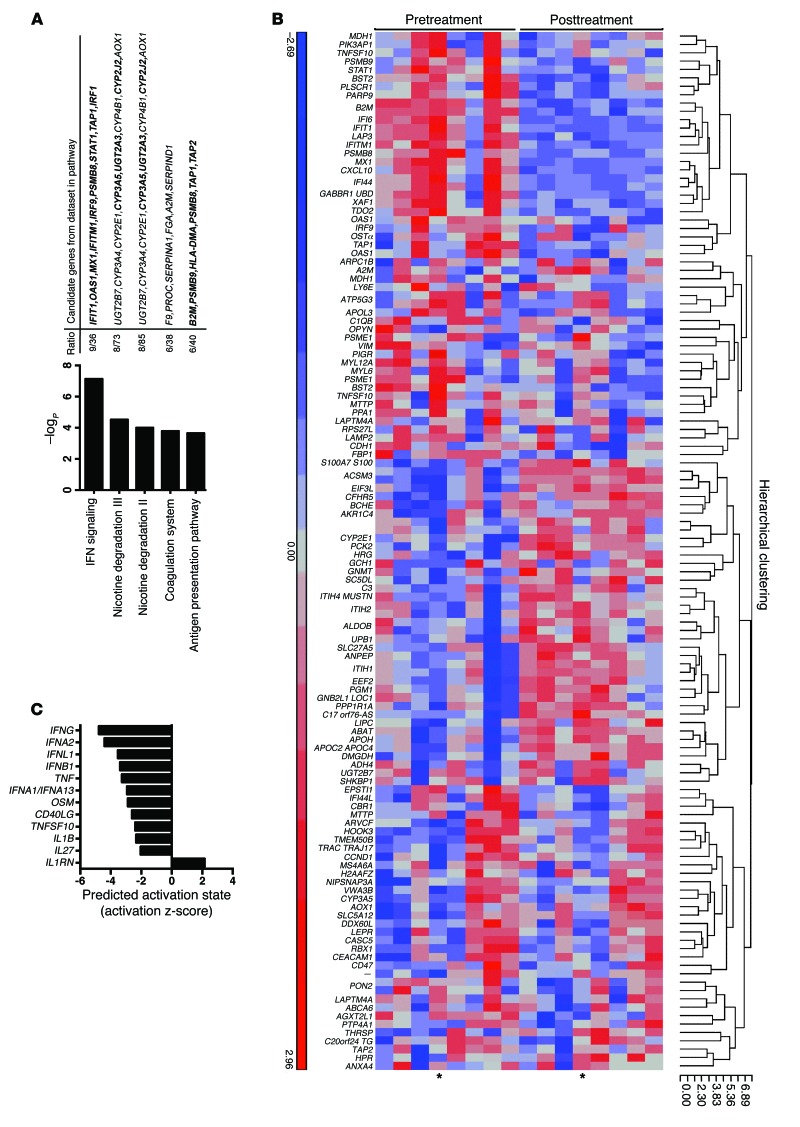
Figure 1. Microarray mRNA expression analysis reveals downregulation of endogenous IFN signaling in liver after SOF/RBV treatment.
(A) Top canonical pathways identified by IPA as changing over the course of treatment in paired liver biopsies (n = 8). Ratios represent the number of genes identified among the top 1% of differentially expressed genes assigned to specific pathways, relative to the total number of genes in the respective pathway. The cutoff for significance of these enrichments was –logP of 1.3 (P = 0.05). Genes downregulated at EOT relative to pretreatment are shown in bold font. (B) Heatmap of genes differentially expressed after SOF/RBV treatment. The top 1% of differentially expressed genes were filtered using cutoffs of >1.2 for fold difference and unadjusted P < 0.05. Microarray expression data were used to create a hierarchical clustering of samples using a Euclidean dissimilarity measure with average linkage. Data from all 8 paired liver biopsies are shown. Red color indicates higher relative expression. Asterisks denote data from the patient who relapsed. (C) IPA upstream analysis of activation state of proteins annotated as cytokines by IPA, comparing EOT versus pretreatment activity levels. Negative z scores predict a less active state of cytokines at EOT compared with pretreatment. Scores of >2 or <–2 were considered significant.

