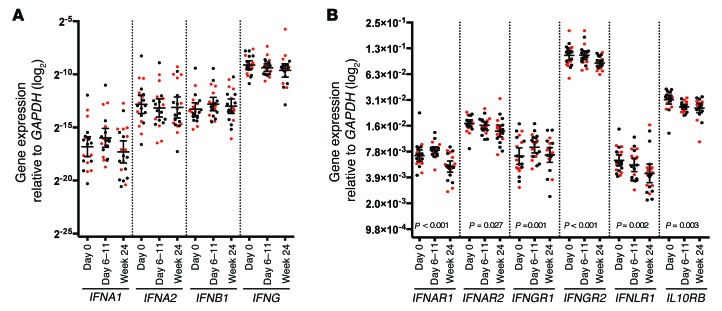
Figure 6. Treatment-induced changes in expression of IFNs and IFN receptors in PBMCs.
Total RNA from PBMCs of 22 patients (12 SVR, black; 10 relapse, red) was analyzed for gene expression of IFNs (A) and IFN receptors (B) by qRT-PCR using 2 ng RNA per assay with technical duplicates. Group median and interquartile range is shown. A linear mixed-effects model was used to determine P for change in gene expression over the course of treatment, with significant P values displayed. Gene expression of IFNL1, IFNL2, IFNL3, and IFNL4-ΔG was not detected using equal amounts of RNA (not shown).

