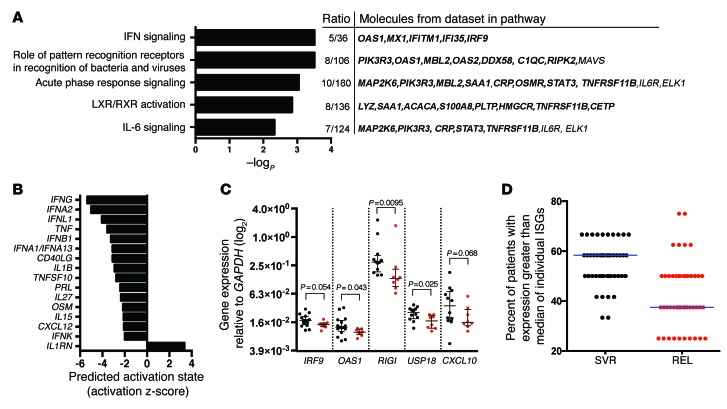
Figure 7. Patients who relapse have lower expression of an IFN gene signature at EOT in liver.
(A) Top IPA canonical pathways differing between SVR and relapse patients from EOT liver biopsy microarray mRNA expression data. Ratios represent genes among the top 1% of genes differentially expressed by outcome assigned to specific pathways, relative to the total number of genes in the respective pathway. Genes with lower expression at EOT in relapse vs. SVR patients are denoted by bold font. (B) IPA upstream analysis of predicted activation state of proteins annotated as cytokines in EOT liver biopsies, comparing SVR and relapse patients. Negative activation z scores predict lower activation at EOT in patients who relapsed. Scores of >2 were considered significant. (C) qRT-PCR validation of select ISGs. qRT-PCR analysis was performed using 2.5–5 ng RNA per reaction. Expression of IRF9 and OAS1 was measured in technical duplicates (n = 16 [SVR; black]; 8 [relapse; red]), whereas other ISGs were tested as single replicates due to sample limitations (n = 12 [SVR; black]; 8 [relapse; red]). Statistical analysis was by Mann-Whitney test. Shown are individual measurements with group median and interquartile range. (D) qRT-PCR expression analysis of 46 ISGs in EOT liver biopsies from patients with SVR or relapse on SOF/RBV treatment. Median relative expression for individual ISGs was determined for the 20 patients with sufficient RNA available for analysis (n = 12 [SVR]; 8 [relapse]). For each ISG, the percent of patients in each outcome group with expression above the group median is plotted.

