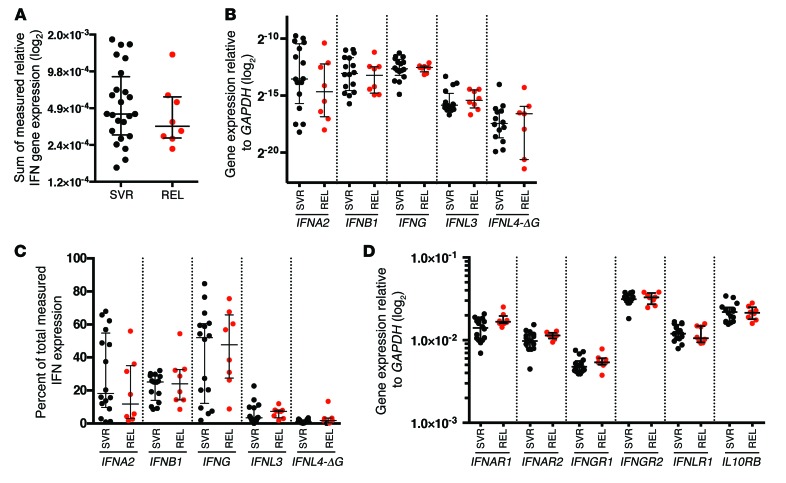
Figure 8. No difference in IFN or receptor expression between by outcome in unpaired EOT liver biopsies.
(A) Sum of total expression of IFNs, including IFNA2, IFNB1, IFNG, IFNL3, and IFNL4-ΔG. (B) Expression of individual IFN genes. (C) Relative expression of individual IFN genes as a percentage of total IFN expression. (D) Expression of IFN receptors. Data are from SVR (n = 16; black) and relapse (n = 8; red) patients in unpaired EOT liver biopsies. All assays were performed with technical duplicates using 2.5–5 ng RNA per reaction, with the exception of IFNA2 (25 ng). Shown are individual measurements with group median and interquartile range. Expression of IFNL1 and IFNL2 was not detected in any sample. No P values met criteria for significance (P < 0.05, Mann-Whitney test).

