
Figure 2.
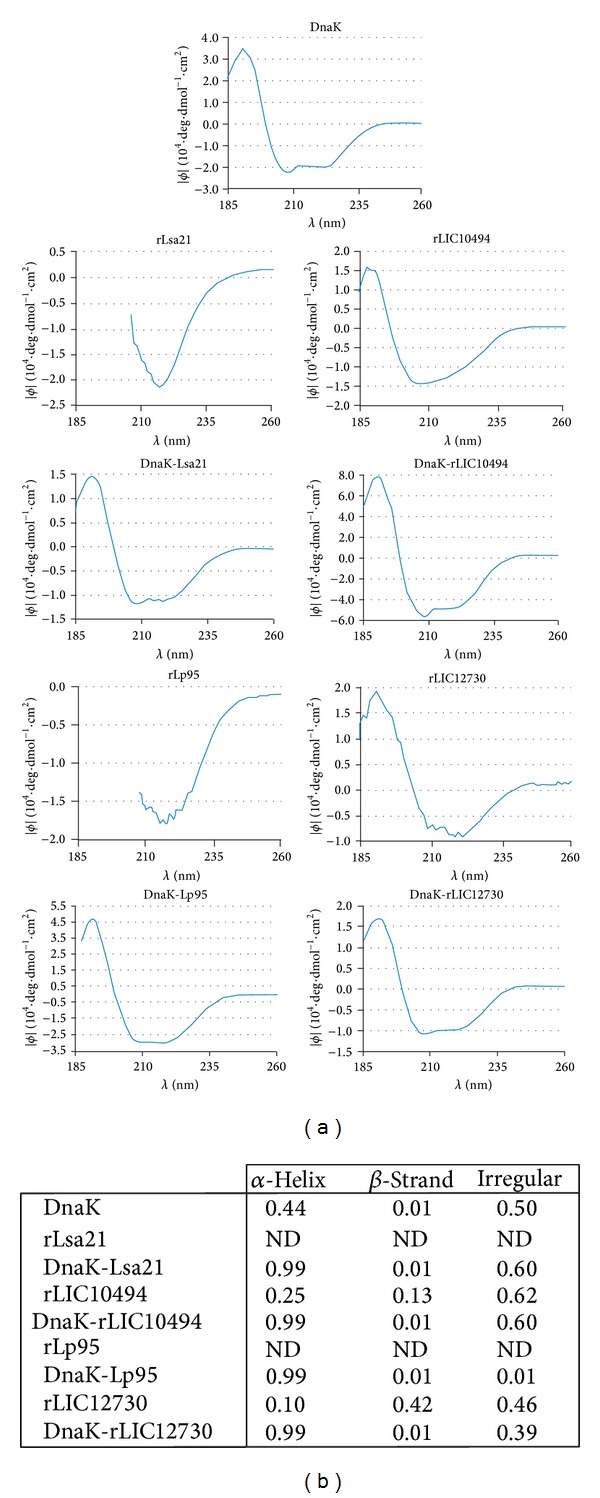
CD spectra of purified recombinant proteins depicted after refolding. (a) CD spectra (FAR-UV CD) of 10 μM of each recombinant protein in 10 mM Na-phosphate buffer (pH 7.4), except Lsa21 and Lp95 C-terminus region that were in 100 mM Tris (pH 12.0) 500 mM NaCl, performed at 20°C. Far-UV CD spectra are represented as an average of five scans recorded from 185 to 260 nm. Ellipticity (ϕ) is expressed in function of wavelength. (b) Percentage of secondary structure of the recombinant proteins according to the analysis of CD spectra data by the CAPITO software. ND: not determined.