
Figure 8.
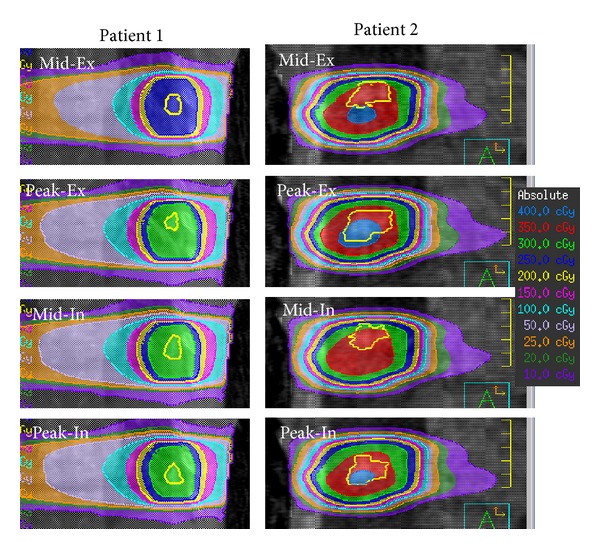
Dose distributions in each phase at the first fraction for 2 patients (coronal view). The yellow contour in each image indicates the gross tumor volume.
Official websites use .gov
A
.gov website belongs to an official
government organization in the United States.
Secure .gov websites use HTTPS
A lock (
) or https:// means you've safely
connected to the .gov website. Share sensitive
information only on official, secure websites.
Dose distributions in each phase at the first fraction for 2 patients (coronal view). The yellow contour in each image indicates the gross tumor volume.