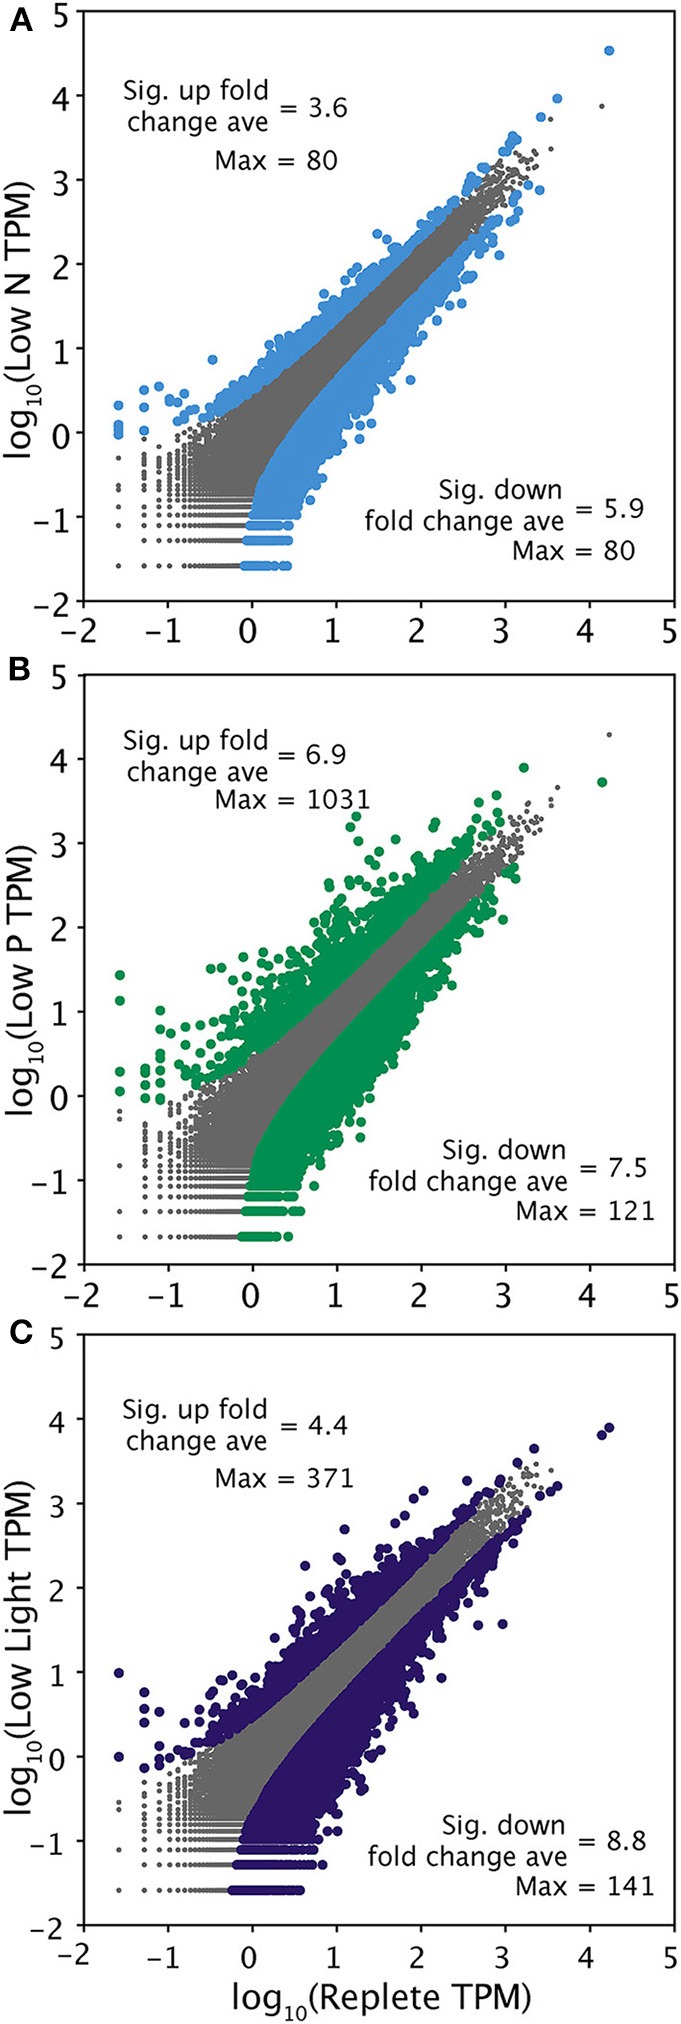
Figure 2.

Pairwise comparison of transcriptional responses across 37,314 contigs generated by a 90% clustering of the Trinity assembly in each treatment relative to the replete control. Transcriptome-side gene expression patterns are shown in low N (A), low P (B), and low light (C). Transcripts were normalized to total library size in tags per million (TPM). Gray points represent transcripts that were not significantly differentially regulated. Significance (colored points) was determined with ASC using a fold change greater than or equal to 2 and a posterior probability greater than 0.95 (Wu et al., 2010). The average significant fold change and maximum fold change value of up and downregulated transcripts is noted.
