
Figure 3.
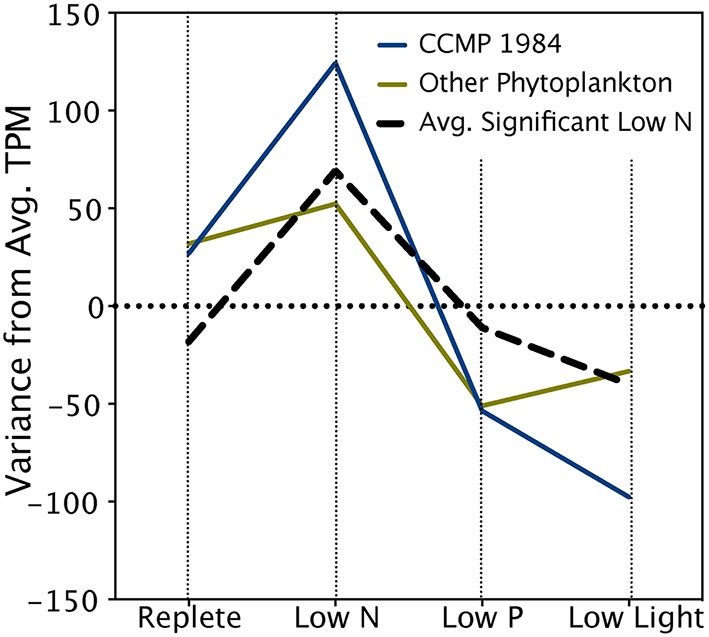
Expression patterns of key nitrogen metabolism transcripts. The black hashed line denotes the mean variance in expression across treatments of transcripts significantly upregulated in the low N treatment. Significance was determined with ASC using a fold change greater than or equal to 2 and a posterior probability greater than 0.95 (Wu et al., 2010). The blue line denotes the average variance in expression of transcripts from this study with functional annotations previously determined to be significantly upregulated during low N conditions in A. anophagefferens CCMP 1984 (Berg et al., 2008; Wurch et al., 2011b) (See Table 5). The green line denotes the variance in expression of transcripts from this study with functional annotations identified as upregulated during low N conditions in diatoms or coccolithophores (Dyhrman et al., 2006, 2012; Allen et al., 2011; Bender et al., 2014) (See Table 5).