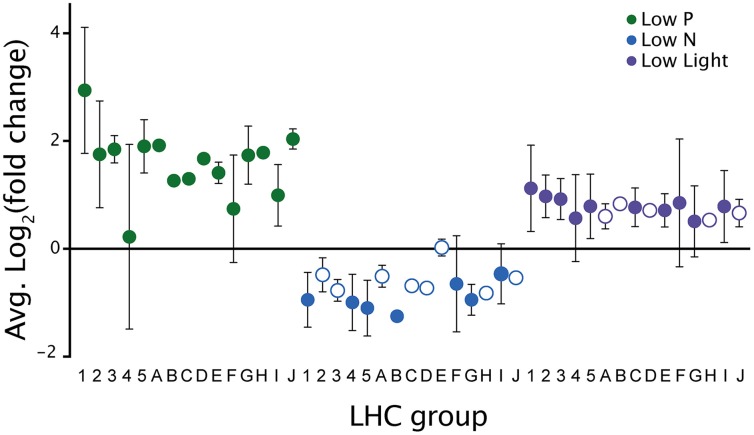
Figure 7.
Expression patterns of light harvesting complex (LHC) transcripts between treatments. The notation on the x-axis refers to the phylogenetic groups of different LHC genes identified in the A. anophagefferens CCMP 1984 genome (Gobler et al., 2011). Filled circles indicate LHC groups with significantly differentially expressed contigs in the LHC group. Open circles indicate a lack of significant differentially expressed contigs in the LHC group. Error bars denote standard deviation.

