Figure 3.
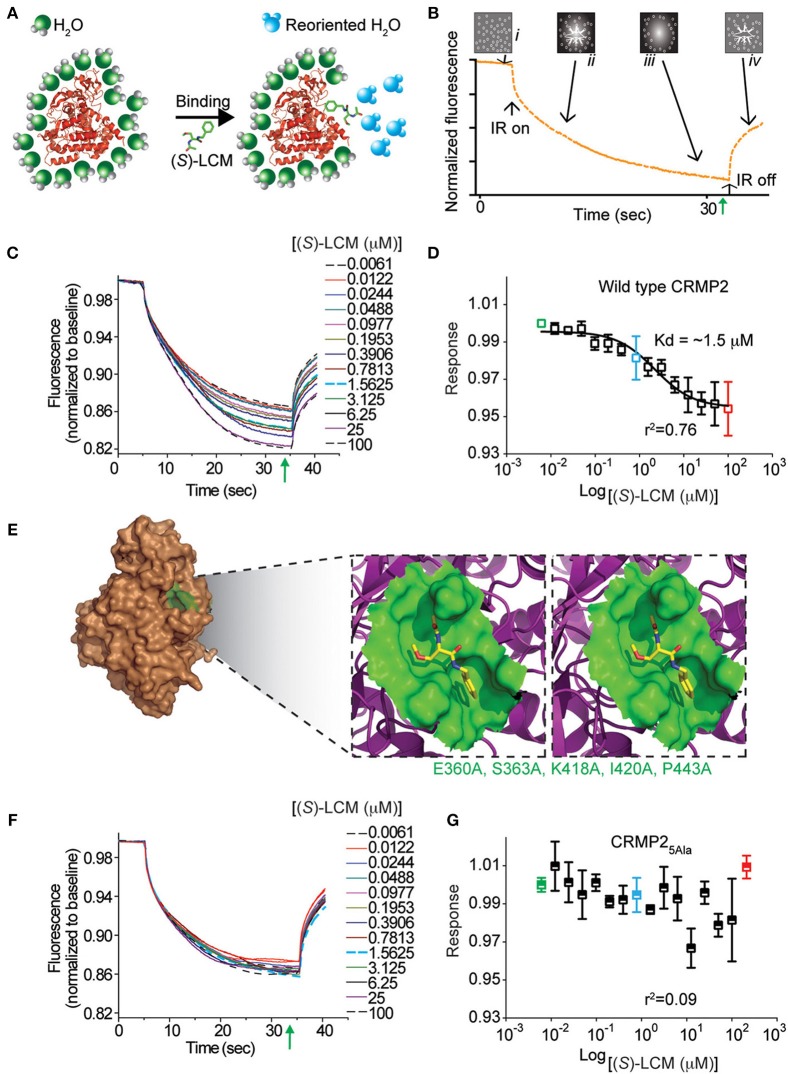
(S)-LCM binds to wildtype CRMP2 in solution measured by microscale thermophoresis (MST). (A) Illustration of hydration shell changes after small molecule [i.e., (S)-LCM] binding to a macromolecule. The changes in the hydration shell properties are detected in the MST instrument. (B) MST assay principle. The four stages in a thermophoresis experiment: (i) initial state (all molecules are randomly distributed); (ii) infrared (IR) laser is turned on, and thermophoresis commences; (iii) steady state flow while IR laser is turned on; and (iv) equilibration to initial state by back-diffusion with IR laser turned off. The green arrow represents the steady-state time point at which the MST measurements were analyzed for the graphs shown in (D,G). (C) MST time traces of concentrations of (S)-LCM ranging from 0.006 to 100 μM. Increasing concentrations altered thermodiffusion of NT-647 labeled CRMP2. (D) MST values were used to determine dissociation constant for binding of (S)-LCM to wildtype CRMP2, apparent Kd = 1.5 ± 0.01 μM; the curve was fit with an r2 value of 0.76. (E) Stereo view of the binding site for (S)-LCM within one monomer of the CRMP2 structure (Stenmark et al., 2007; Wang et al., 2010b). (S)-LCM is shown in capped-sticks representation. The amino acids mutated to alanines are indicated in green text. (F) MST time traces of concentrations of (S)-LCM ranging from 0.006 to 100 μM. MST experiments were repeated using NT-647 labeled CRMP25ALA harboring mutations in residues as indicated in (E). (G) No association could be detected between (S)-LCM and CRMP25ALA. The data could not be fitted with a curve (r2 = 0.09). A representative of range of data points obtained from at least 3 measurements is shown.

