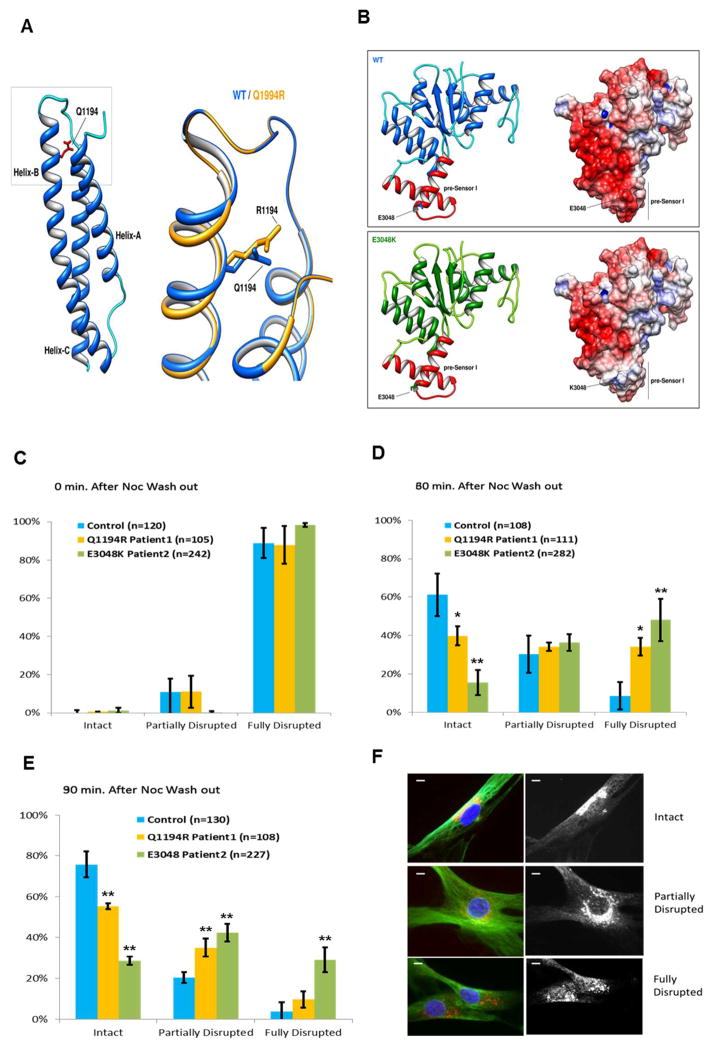
Figure 2.
A–B Protein modeling
A) Cartoon representation of secondary structure elements of the tail/linker region of cytoplasmic dynein 1 heavy chain 1 protein. The model exhibits the typical three helix fold of the spectrin repeat-domain (pfam00435) with the. Gln1194 residue (highlighted in red) located in the α-helix B. The box is shows a magnification of the region of interest with the predicted consequences of the replacement of Arginine for Glutamine at residue 1194. The effect of mutation on protein structure and stability, as predicted by Rosetta Backrub server and FoldX, is that it determines a change in the conformation of the α-helix B and decreases the global stability of the domain (ΔΔG: 4.66 ± 0.18 kcal/mol).
B) Cartoon (left) and electrostatic surface (right) representations of wild-type (upper) and c.9142G>A (p.Glu3048Lys) (lower) AAA4-α/β submodule of human DYNC1H1 (residues 2870–3096). The AAA4-α/β domain exhibits the Rossmann-type fold with the Glu3048 residue located in the pre-Sensor I region (colored in red), the characteristic insert that extends from α-helix 3 and β-sheet 4 of the AAA4 module. The c.9142G>A (p.Glu3048Lys) mutation slightly decreases the global stability of the domain (ΔΔG: 1.06±0.08 kcal/mol) but severely alters the electrostatic surface of the pre-Sensor I region of AAA4 domain. Electrostatic surface potentials were colored according to charge with blue denoting positive charge (+5 kT/e-) and red, negative charge (−5 kT/e-).
C–E Nocodazole washout experiments with cultured skin fibroblasts from patients 1 and 2 (yellow and green bars respectively) or a control individual (cyan bars) lacking the dynein mutations. Results are shown as percentage of cells from each cell line with bracketed numbers representing the number of cells examined. C) For all cell lines, at the time of nocodazole exposure, nearly 100% of cells had a fully disrupted Golgi. D) At 30 minutes after nocodazole washout, a higher percentage of cells from patients 1 and 2, as compared to control cells, showed a fully disrupted Golgi. E) At 90 minutes after nocodazole washout, the percentage of cells with a fully disrupted Golgi was higher in patient cells compared to control cells. This was particularly evident in patient 2, where the number of cells retaining a fully disrupted Golgi was nearly 50% of the total. Results are taken from at least 3 Independent experiments. Error bars=standard deviation; n= number of cells. Unpaired t-test: *, p<0.05 **, p<0.001.
F. Representative images of cultured skin fibroblasts with intact (upper panel), partially disrupted (middle panel) and fully disrupted (lower panel) Golgi are shown. Golgi is stained in red. Scale bars=5μm.

