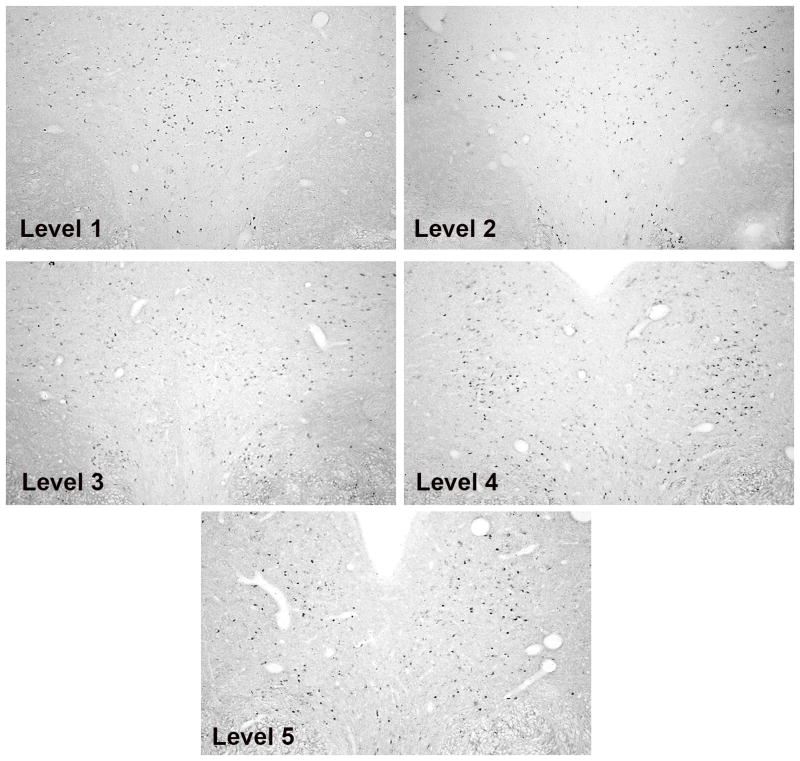
Figure 3.
TPH2 digoxigenin ISH staining is shown to illustrate the morphology of the raphe at the 5 levels that were subjected to analysis. Levels 1–3 were obtained from a DHT+ATD-treated animal and levels 4–5 were obtained from a T-treated animal because these groups exhibited the most robust signals. These images were obtained on the Marianas Stereology Workstation with Slidebook 5.0 and represent the typical areas that were analyzed.

