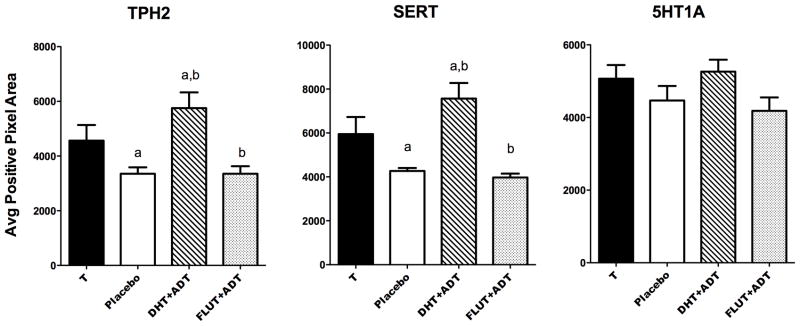
Figure 4.

Histograms illustrating gene expression for TPH2, SERT and 5HT1A in castrated male macaques treated with T, placebo, DHT+ATD and FLUT+ATD. There was a difference between the groups in TPH2 expression (F [3,14] =6.2; ANOVA p= 0.0067) and in SERT expression (F [3,14] = 8.6; ANOVA p=0.0018). There was no difference post-hoc between T- and DHT+ATD-treated groups. There was no difference between the groups in 5HT1A autoreceptor expression after 3 months of treatment. Groups with the same letter are different by Newman-Keuls posthoc pairwise comparison (p< 0.05).
