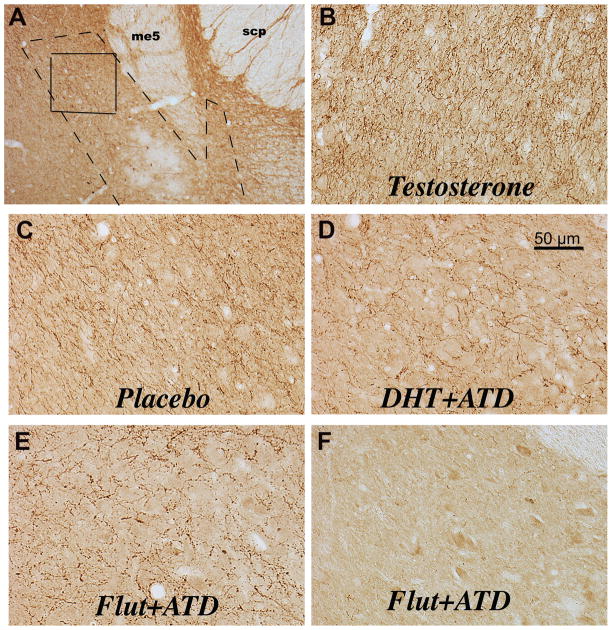
Figure 5.
Photomicrographs of the serotonergic innervation of the locus ceruleus. Panel A indicates the location of the LC noradrenergic neurons (dashed line) and the area examined for serotonin axons and varicosities (solid line). The landmarks in this area include the mesencephalic 5 tract (me5) and the superior cerebellar peduncles (scp). This photograph is representative of level 3 in our analysis and corresponds to level 3 in a previous publication of tyrosine hydroxylasae immunostaining in the locus ceruleus (Bethea et al., 2012a). Panels B, C and D illustrate representative serotonin immunostaining of axons and varicosities over and around the noradrenergic neurons of the locus ceruleus. The serotonin axons are coursing around large unstained neurons (blank areas) in panels D and E. It is difficult to see the neurons under the dense serotonin axons in panels B and C. Panel F illustrates the LC from one animal in which serotonin axons were nearly absent. The serotonin axons are extremely dense in the T-treated male and decrease somewhat in the placebo-treated male. Administration of ATD markedly decreases serotonin axon density in the presence (DHT) or absence (FLUT) of androgens.

