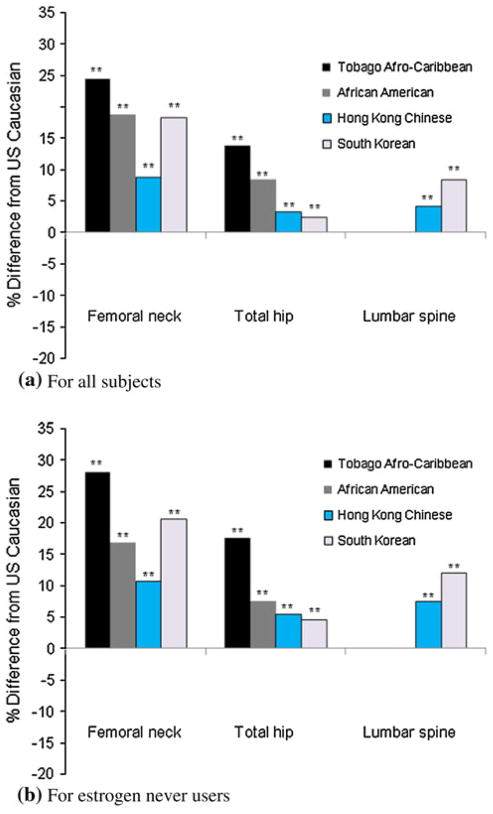
Fig. 3.
Percentage differences in all covariates (age, weight, height, grip strength, smoking amount, current alcohol consumption, dietary calcium intake, years since last menstrual period, diabetes mellitus and hypertension) adjusted mean of BMD among Afro-Caribbean, African American, Hong Kong Chinese and South Korean women compared to US Caucasian women 65 year or older: a for all subjects, b for estrogen never users. **p <0.001 by Tukey test comparing BMD between US Caucasian women and each ethnic group

