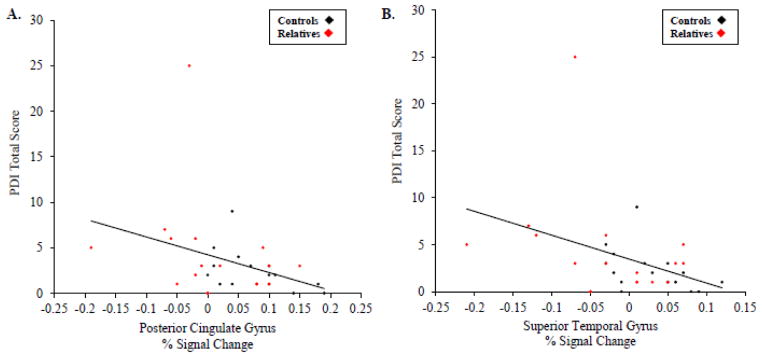
Figure 2.

Correlations between subclinical delusions and SR-AL responses. Scatter plots display the negative correlations between PDI total score and the SR-AL responses (percent signal change) of the PCC (r = −.42; df = 30; p = .01) (A) and the STG (r = −.49; df = 30; p = −.004) (B) in the full sample (n = 32).
