Fig. 1.
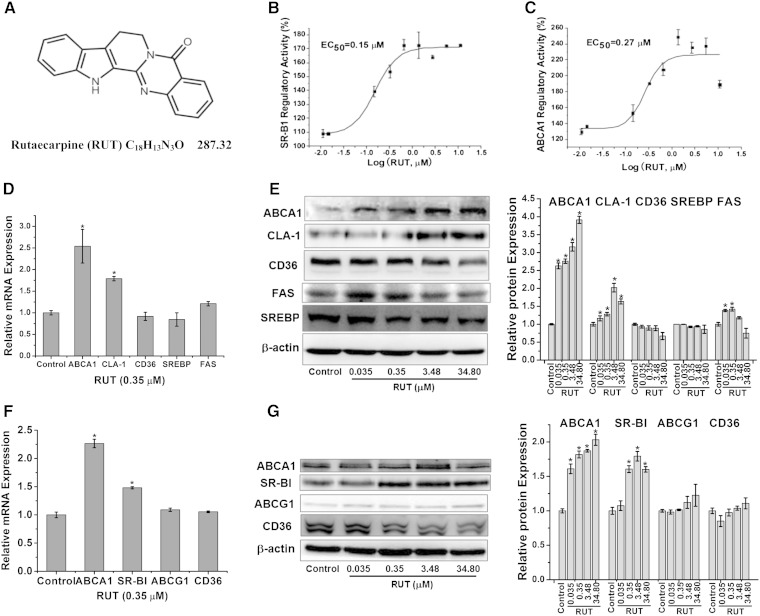
The multiple target nature of RUT in vitro. Chemical structure of RUT (A); dose-dependent curves for RUT (in log scale) in ABCA1p-LUC HepG2 cells (B) and CLA-1p-LUC HepG2 cells (C). Quantitative data are the mean ± SEM from at least three separate experiments; mRNA levels in HepG2 cells (D) and RAW264.7 cells (F) of indicated genes were determined by real-time PCR, respectively. Data are expressed as means ± SEM of three independent experiments and are relative to that of control. * P < 0.05 versus control. Protein levels in HepG2 cells (E) and RAW264.7 cells (G) of indicated genes were determined by Western blotting, respectively. A representative immunoblot in HepG2 cells (E) and RAW264.7 cells (G) is shown, respectively, and the abundances were normalized to that of β-actin. Data are expressed as means ± SEM of three independent experiments and are relative to that of control. * P < 0.05 versus control.

