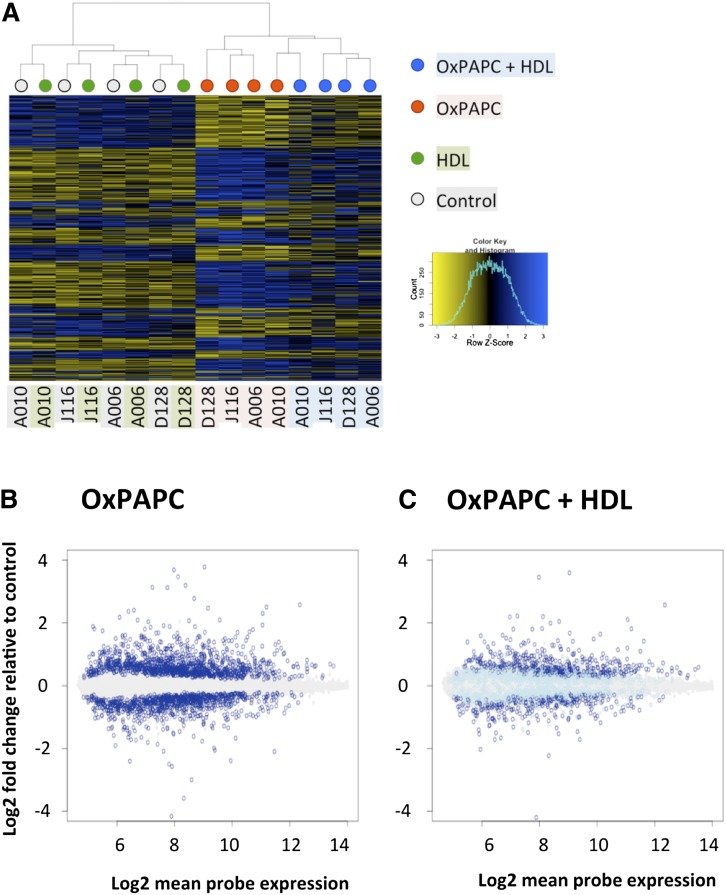
Fig. 1.
HDL affects 52% of genes regulated by OxPAPC. HAECs from four unique donors were treated with HDL (40 μg/ml), OxPAPC (40 μg/ml), or both (OxPAPC+HDL), and mRNA was isolated and subjected to microarray analysis. Differentially expressed genes as compared with control samples (false discovery rate adjusted P < 0.05) were identified in OxPAPC-treated samples and in OxPAPC+HDL-treated samples independently. OxPAPC regulated 1,679 genes out of the 14,899 genes analyzed on the array. A: Heat map showing the pattern of regulation of genes affected by OxPAPC in untreated cells, cells treated with HDL, cells treated with OxPAPC, and cells treated with OxPAPC+HDL. Dendogram on top shows clustering of the samples, where color of the nodes represents treatment group: gray for control, green for HDL, red for OxPAPC, and blue for OxPAPC+HDL. Individual donors are indicated below the heat map. Each sample was hybridized to two arrays, and expression was averaged between the technical replicates. While HDL itself has no apparent effect on gene expression (and on samples clustering), OxPAPC+HDL-treated samples clearly cluster separately from OxPAPC-treated samples, indicating a global effect of HDL on OxPAPC-related changes in gene expression. B: Log2-fold change of probe expression in OxPAPC-treated samples as a function of mean probe expression (x-axis). Genes that were not affected by OxPAPC are in gray. Genes that were significantly induced or repressed by OxPAPC are shown in dark blue. C: Fold change of expression of OxPAPC-affected genes (dark blue in B) in OxPAPC+HDL-treated samples. As in B, genes unaffected by OxPAPC are shown in gray. Genes affected by OxPAPC (dark blue in B) are shown in either dark blue or light blue. Dark blue indicates genes significantly affected by OxPAPC and not reversed by HDL, while light blue indicates genes reversed by HDL.

