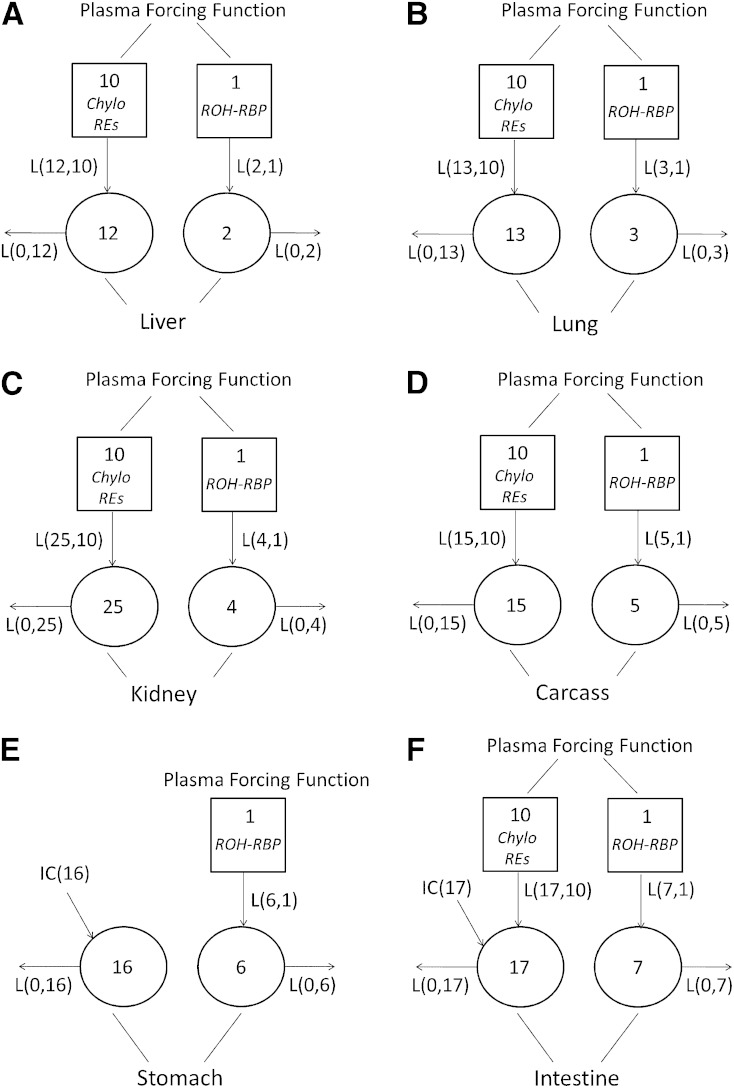
Fig. 3.
Proposed models with forcing function for VA metabolism (model 1) in liver (A), lung (B), kidney (C), carcass (D), stomach (E), and intestine (F) in neonatal rats administered [3H]retinol in oil or in VARA based on the tissue tracer response data. Compartments are represented as circles, and interconnectivities between compartments correspond to L(I,J)s or the fraction of the material in compartment J transferred to compartment I per day. The squares represent plasma forcing functions. Compartment 10 describes the profile of plasma tracer in CM/CM remnants retinyl ester. Compartment 1 describes the profile of plasma tracer in retinol. Compartments 12, 13, 29, and 15 represent retinyl ester that is taken up from plasma CM/CM remnants by liver, lung, kidney, and carcass, respectively. Compartments 2, 3, 4, 5, 6, and 7 represent VA in liver, lung, kidney, carcass, stomach, and intestine, respectively, that exchanges with plasma retinol. Compartment 16 represents the processing of newly ingested VA in stomach. Compartment 17 represents the processing of newly ingested VA in intestine and retinyl ester that is taken up from plasma CM/CM remnants by intestine. IC(16) and IC(17) represent the newly ingested dose that enters the stomach and the intestine, respectively.

