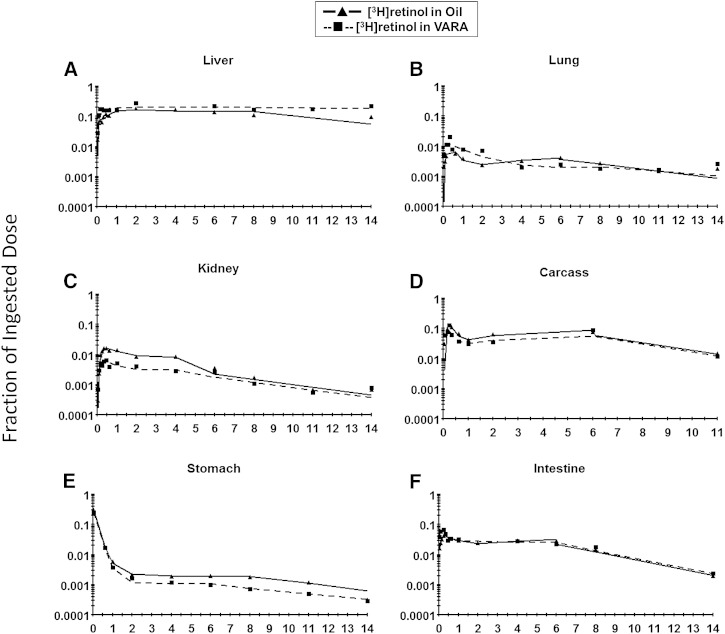
Fig. 4.
Mean observed (symbols) and model 1-predicted fraction of administered dose (lines) in liver (A), lung (B), kidney (C), carcass (D), stomach (E), and intestine (F) versus time (days) after administration of [3H]retinol in oil or in VARA to neonatal rats. Each point represents the mean of n = 3 pups.

