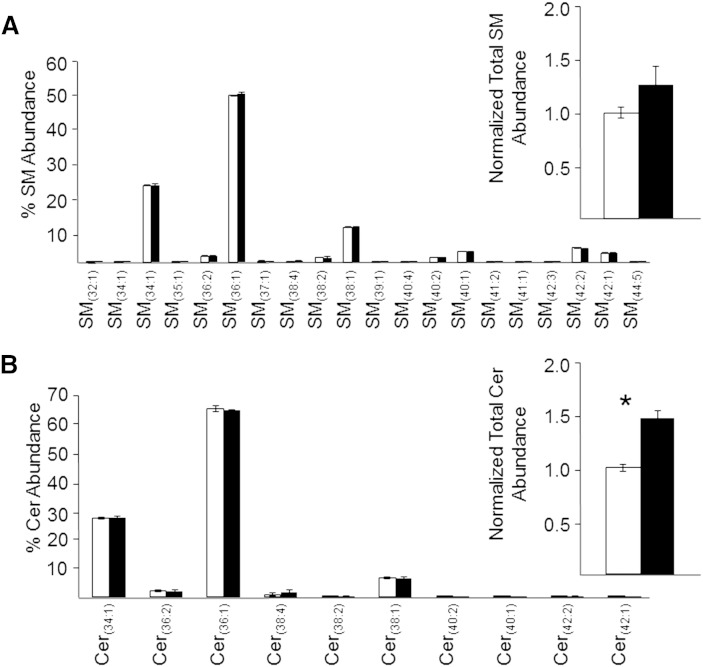
Fig. 7.
Modified Folch lower phase (open bars) and monophasic (filled bars) retina lipid extracts (sample concentration corresponding to 1.0 mg/ml of original retina tissue extracted) were subjected to positive ionization mode high-resolution (R = 100,000)/accurate MS for quantitative comparison of individual SM lipid species as a percent of the total SM ion abundance (A) (inset: normalized ion abundances summed for all SM species) and individual Cer lipid species as a percent of the total Cer ion abundance (B) (inset: normalized ion abundances summed for all Cer species). Data represent the mean ± standard deviation from n = 3 separate lipid extracts. *P < 0.05.

