
Figure 3.
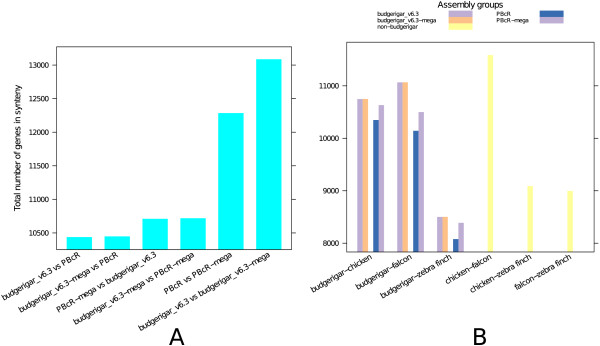
The number of genes that are part of a syntenic block between different budgerigar assemblies (A) and between budgerigar and non-budgerigar assemblies (B). The numbers were calculated from CoGE syntenic dotplots (not shown), as the total number of genes represented in syntenic blocks. The y-axis limits have been cut off close to the minimum value in the plot to show a more detailed spread of values.