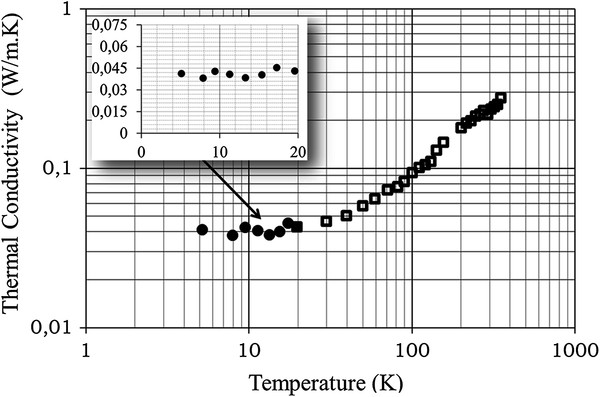
Figure 2.

Temperature dependence of porous Si thermal conductivity. The graph shows experimental results of thermal conductivity of porous Si for temperatures between 5 and 20 K (present results, full points in the main figure and in the inset) and for temperatures in the range 20 to 350 K (open rectangles; previous results by the authors [18]). The plateau-like behavior for the 5 to 20 K temperature range is illustrated, with a mean value of 0.04 W/m.K.
