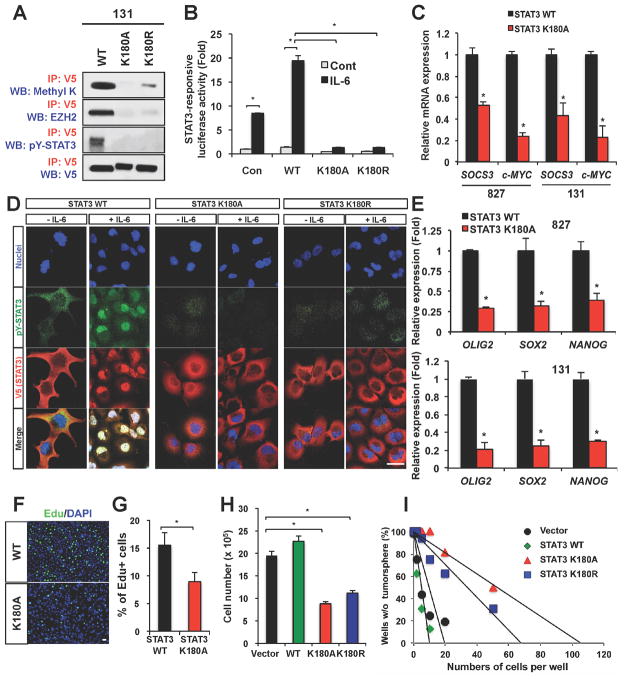
Figure 4. Effects of STAT3 methylation on STAT3 activity and GSC self-renewal.
(A) Co-IP analyses of methylated STAT3, pY-STAT3 and the EZH2-STAT3 complex in 131 GSCs expressing STAT3 K180 mutants. V5 is a protein tag fused with STAT3. Methyl K denotes an antibody recognizing either di- or tri-methylated lysine. (B) STAT3 transcriptional activity in response to IL-6 in 131 GSCs expressing the empty vector control, wild-type STAT3, or the STAT3 K180 mutants. * p < 0.01. (C) Real time RT-PCR analysis to determine mRNA levels of SOCS3 and c-MYC in GSCs (827 and 131) expressing either wild-type or STAT3 K180A mutant. Messenger RNA levels of SOCS3 and c-MYC in STAT3 K180 expressing cells were compared to those in wild-type STAT3 expressing cells (set to 1). Data are means ± SD (n = 3). * p < 0.01. (D) IF staining of pY-STAT3 (green) on GSCs expressing the wild-type STAT3 and STAT3 K180 mutants in response to IL-6 (50ng/ml). V5 (red) was used to stain exogenous STAT3 and DAPI (blue) was used to stain nuclei. (E) Real time RT-PCR analysis to determine mRNA expression of stem cell associated transcription factors (OLIG2, SOX2, and NANOG) in GSCs (827 and 131) expressing STAT3 mutants. Data are means ± SD (n = 3). * p < 0.01. (F to I) Effects of STAT3 K180 mutant overexpression on proliferation and clonogenic growth of GSCs. 5′-ethynyl-2′-deoxyuridine (EdU)-positive cells (stained green) were counted in three random fields and plotted (in F and G). *p < 0.01. Cell counts of STAT3 mutant-expressing GSCs after 6 days of culture (H) and limiting dilution assay results (I) were shown. Error bars represent SD. Bars (in D and F) represent 10 microns. See also Figure S2.

