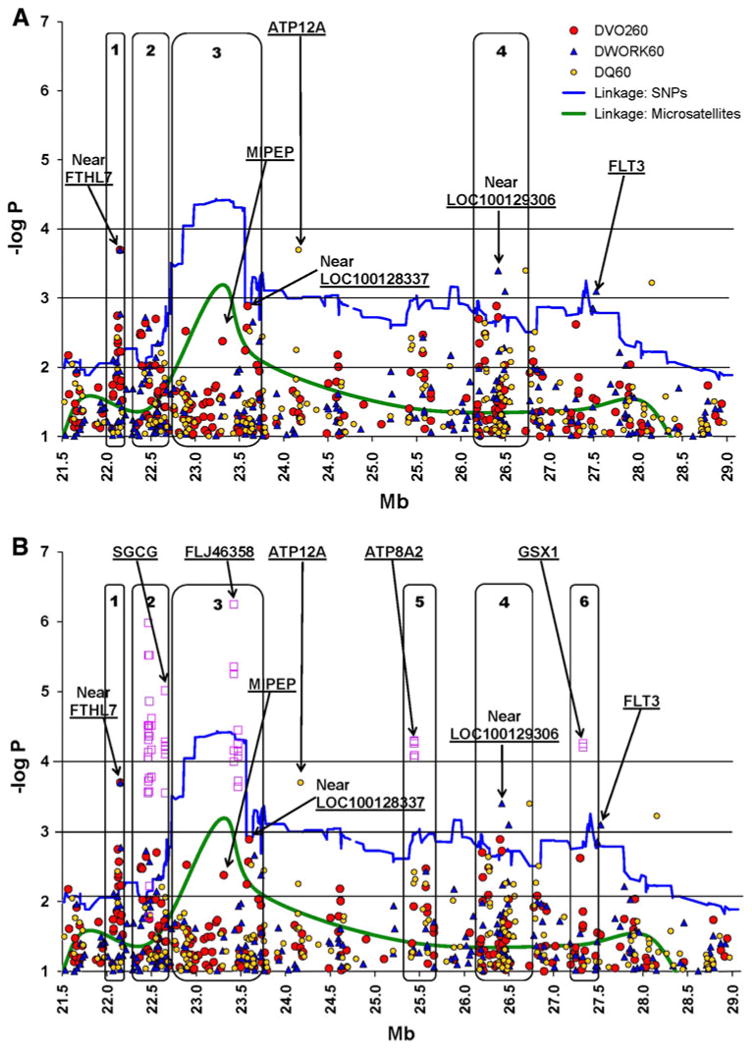
Fig. 1.

Family-based associations for ΔVO260 (labeled as DVO260) and correlated traits (ΔWORK60 and ΔQ60, labeled as DWORK60 and DQ60), with –log P values adjusted for multiple comparisons for chromosome 13q12.11-q12.3. The X-axis represents the SNP locations (in Mb units) and the Y-axis represents the –log P values for the association models (circle) or the LOD scores for the linkage models (solid lines). Noise was reduced by plotting only for –log P values that are at least 1.0. Linkage plots are presented for both micro satellites (original linkage scan) and SNPs (fine mapping). Blocks 1–6 represent arbitrary regions where the signals are large or concentrated. The top panel (a) represents the results for the single-SNP analyses. In the bottom panel (b), the superimposed square symbols represent the haplotype analysis results. SNP (or haplotype) signals that are located within genes are shown at the top of the bottom panel (SGCG, FLJ46358, MIPEP, ATP12A, ATP8A2, GSX1, FLT3, FLT1, PAN3). For the four best single-SNP results (–log P > 3.0), the closest genes are defined as Near FTHL7 (rs9506903 138,483 bp), Near LOC646208 (rs971206 6,460 bp), Near LOC100128337 (rs2104257 1,421 bp), Near LOC100129306 (rs7326591 69,878). See text for details
