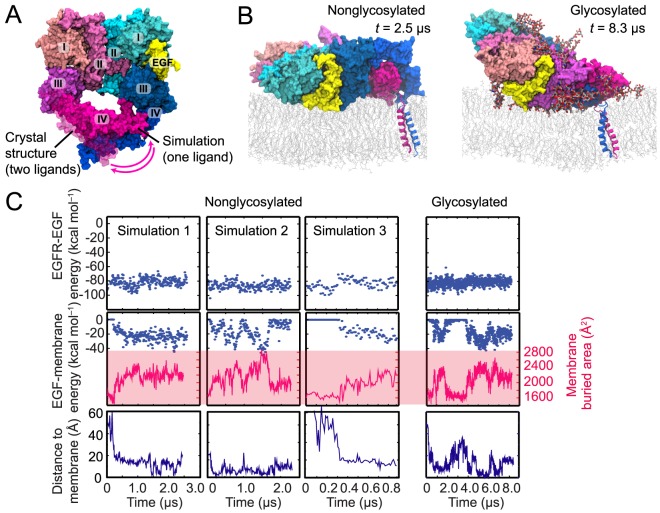
Figure 3. Simulations of the one-ligand dimer.
(A) The conformation of the one-ligand ectodomain dimer obtained from a simulation employing the crystal structure of the two-ligand dimer (PDB entry 3NJP; ref. [23]), with the ligand removed from the red subunit, as a starting state. Domains I–IV and the EGF molecule are marked. The one-ligand dimer differs from the two-ligand dimer in the conformation of the domain IV of the red subunit. (B) The one-ligand dimer lying down on the membrane. The ligand bound to this dimer faces the membrane. Snapshots from simulations of the nonglycosylated and glycosylated dimers are shown. (C) The free energy of a ligand's interaction with its host receptor in a one-ligand EGFR dimer (upper panels) estimated using MM/GBVI, the strength of its interaction with the membrane bilayer (middle panels) estimated in the same way, and the distance between the ligand's N-terminus and the membrane (lower panels) in three independent simulations in which the receptors were not glycosylated and in one additional simulation in which they were. Also shown (middle panels) is the total surface area of the ligand buried due to its interactions with the receptor and the membrane. As indicated by these data, the additional free energy conferred by the ligand's membrane interaction is a significant fraction of its interaction energy with the receptor.

