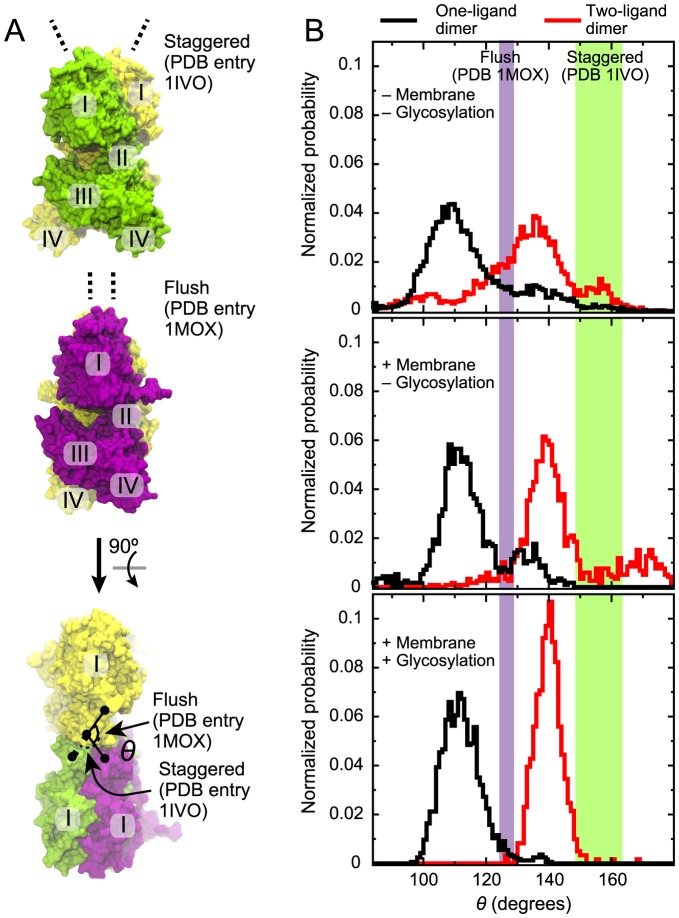
Figure 6. “Staggered” and “flush” conformations of the extracellular dimers.
(A) The staggered and flush conformations [20] are observed in PDB entries 1IVO and 1MOX, respectively. These two conformations are shown at the top and in the middle. At the bottom, the yellow subunits of both crystal structures are superposed and the view is from above (relative to the other two images). The conformations can be distinguished by the angle θ formed by the Cα atoms of Ile190 and Pro204 of one subunit and Pro204 of the other. (B) Distributions of θ observed in simulations of the one- (black) and two-ligand (red) EGFR dimers. Data from the simulations of ectodomains in solution, reported in ref. [26], and data from simulations of nonglycosylated and glycosylated EGFR constructs with the membrane, which are reported in the present study, are shown from top to bottom, respectively. Values of θ from the crystal structures are indicated. Two slightly different θ values are obtained for each crystal structure, because the structures are not exactly symmetric; the spaces between these values are shown as colored bands.

