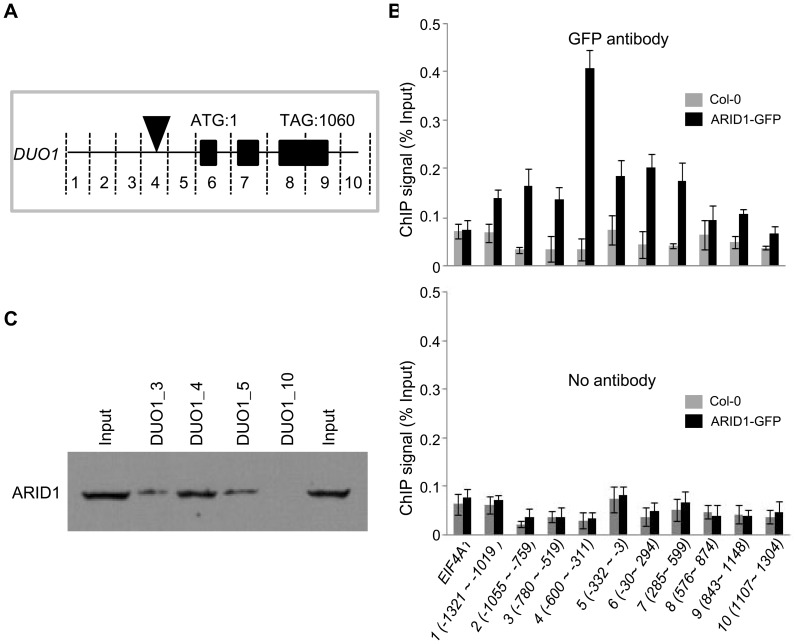
Figure 3. ARID1 binds to DUO1.
(A) Schematic of subfragments of DUO1 genomic DNA. The black rectangles represent exons. The black triangle indicates the region where ARID1 was most abundant. The position of the ATG was set to 1, and the fragments upstream or downstream were numbered; for example fragment “1” is −1321 to −1019 bp. (B) ChIP performed with wild type (gray bars) or ARID1-GFP (black bars) with GFP antibody (upper panel) and No antibody control (lower panel). EIF4A1 was used an internal negative control. The results were reproducible in two biological replicates. Error bars show SD calculated from three technical replicates. (C) DNA binding assay. Proteins were resolved by SDS-PAGE and then immunoblotted using anti-ARID1. The input lanes have 1/5 of the amount of ARID1 protein used in the DNA binding assay. The lanes numbered 3, 4, 5 and 10 (corresponding to regions mentioned in (A)) have 1/6 of the DNA-bound protein.

