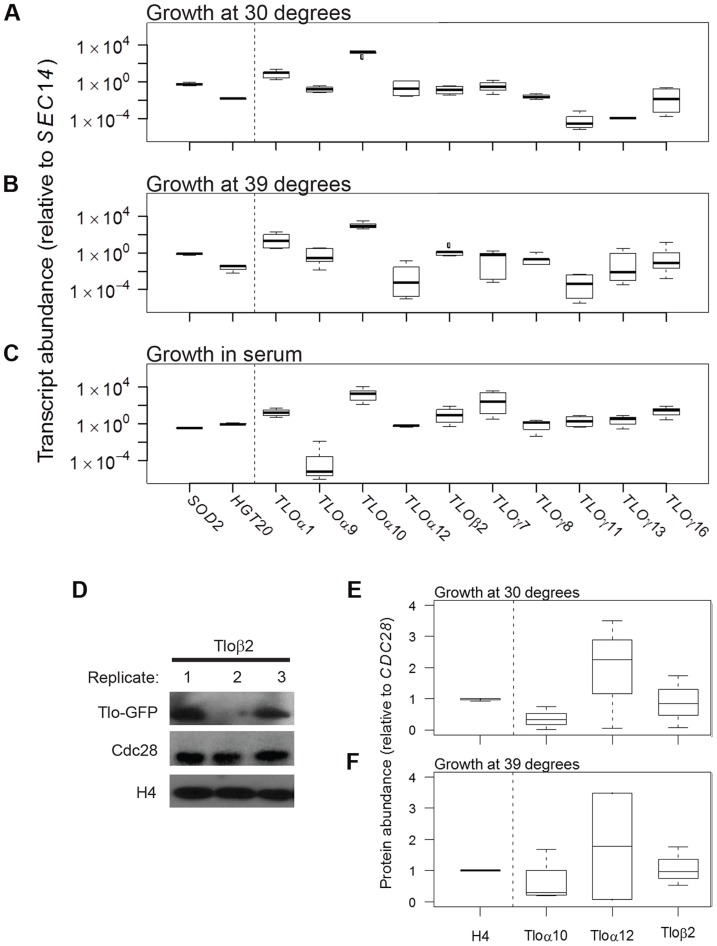
Figure 1. TLO expression is highly plastic at the transcript and protein level.
qRT-PCR measured transcript abundance for ten TLOs representing all three clades in SC5314 and two control genes, SOD2 and HGT20, that are expressed at similar levels. TLO abundance was measured for cells in logarithmic growth at (A) 30°C, (B) 39°C, and (C) under standard growth conditions supplemented with 10% serum. Transcript abundance was generally more variable for TLOs compared to control genes for all condition tested (variability indicated by the length of each box, which demarcates the first and third quartiles). (D) Protein abundance of Tlos and histone H4 was measured by Western blotting assay using Cdc28 as a loading control when cells were grown at either (E) 30°C or (F) 39°C. Tlo abundance was more variable compared to H4 in either condition regardless of clade. A Tloγ clade member, Tloγ5, was also similar variable but is expressed at much lower levels not on a similar scale to these proteins.

